This is an Open Access article distributed under the terms of the Creative Commons Attribution Non-Commercial License (http://creativecommons.org/licenses/by-nc/4.0/) which permits unrestricted non-commercial use, distribution, and reproduction in any medium, provided the original work is properly cited.
Modifiable risk factors account for a substantial proportion of dementia cases and represent important targets for prevention. However, previous studies have often focused on a limited range of risk factors and have rarely examined whether their associations with dementia differ according to sex and age at onset.
Objectives
To investigate sex- and age-specific associations between modifiable risk factors and incident Alzheimer's disease dementia using a nationwide population-based cohort in South Korea.
Methods
We conducted a retrospective cohort study using the National Health Information Database of the Korean National Health Insurance Service. Among individuals who participated in the National Cancer Screening Program in 2006 and underwent general health examinations in 2004, 2006, and 2008, 599,306 adults aged 40–79 years were included. Participants were followed from 2010 to 2019 after applying pre- and post-screening washout periods. Incident Alzheimer's disease dementia was defined using ICD-10 codes F00 or G30. Cox proportional hazards regression models were used to estimate hazard ratios (HRs) and 95% confidence intervals (CIs). Analyses were stratified by sex and age group to distinguish early-onset Alzheimer's disease dementia (EOAD) and late-onset Alzheimer's disease dementia (LOAD). During the 10-year follow-up period, dementia risk profiles differed substantially according to sex and age at onset. Lower educational attainment was consistently associated with increased dementia risk across all groups. Current smoking and physical inactivity were significant risk factors for dementia in both sexes, whereas underweight status was associated with an increased risk of LOAD. Among chronic conditions, diabetes, hypertension, and depression elevated dementia risk, with depression demonstrating the strongest association, particularly for EOAD (males: HR = 3.61, 95% CI: 2.63–4.96; females: HR = 1.83, 95% CI: 1.46–2.29). Sensory and functional impairments, including hearing loss, visual loss, physical disability, and traumatic brain injury, were also associated with increased dementia risk, although the magnitude and significance of these associations varied by sex and age group. The predictive performance of the models was acceptable, with C-statistics ranging from 0.6784 to 0.7803.
Conclusions
The associations between modifiable risk factors and incident Alzheimer's disease dementia exhibited distinct sex- and age-specific patterns. These findings highlight the importance of tailored dementia prevention strategies that account for differences in demographic characteristics and risk factor profiles. Targeted interventions addressing modifiable risk factors may contribute to reducing the future burden of dementia at both individual and population levels.
Dementia is a syndrome encompassing common symptoms such as cognitive decline and behavioral changes caused by brain diseases [1,2]. In South Korea, the prevalence of dementia among adults aged 65 years and older reached 9.25% in 2023 [3]. The national disease burden of dementia, measured in disability-adjusted life years (DALYs), doubled between 2000 and 2019, representing the steepest increase among major chronic diseases [4]. With rapid population aging, dementia is expected to impose an even greater public health burden in the coming decades [5].
When classified according to reversibility, irreversible dementia accounts for approximately 60–95% of all cases. Importantly, neuropathological changes associated with dementia are known to begin 15–25 years before clinical diagnosis [6]. Moreover, clinical diagnosis is typically made only after cognitive impairment interferes with daily functioning, at which point substantial neuropathological damage has already occurred. From an epidemiological perspective, this long preclinical phase provides a critical window for primary prevention. Therefore, identifying individuals at high risk before clinical onset and implementing early preventive interventions represent key public health priorities.
Dementia risk factors are heterogeneous and multifactorial, encompassing health behaviors, cardiometabolic conditions, psychosocial factors, and functional impairments [7]. Given the irreversible nature of dementia and its increasing societal burden, growing attention has been directed toward modifiable risk factors from both prevention and management perspectives. Although earlier epidemiological evidence was limited, advances in etiologic classification and pathophysiological understanding have led to a growing body of observational research on dementia risk factors. Accordingly, numerous cohort studies have investigated the association between modifiable risk factors—such as smoking, alcohol consumption, obesity, and hypertension—and cognitive decline, typically adjusting for sociodemographic covariates [8-15]. Notably, recent studies using population attributable fraction (PAF) analyses have estimated that approximately 45% of dementia cases are potentially preventable by addressing these modifiable risk factors, providing a powerful rationale for population-level intervention strategies [16].
However, existing literature has several limitations. Previous studies have predominantly evaluated dementia risk by focusing on a narrow range of conventional risk factors, such as blood pressure and total cholesterol [17,18]. Crucial comorbidities and sensory or physical impairments, including depression, visual loss, and hearing loss, have often been excluded from comprehensive analyses. Consequently, the distinct impacts of various risk factor profiles on dementia onset remain poorly understood. This gap in the literature primarily stems from the lack of data sources that comprehensively capture socioeconomic factors, health behaviors, chronic diseases, and a wide range of dementia-related risk factors, as well as study design constraints, including the scarcity of comprehensive longitudinal data. Furthermore, while PAF metrics are invaluable for guiding public health policies to improve population-level health, they fundamentally quantify aggregate population risk and fail to evaluate individual-level dementia risk.
To address these limitations, this study aimed to examine sex- and age-specific associations between modifiable risk factors and incident Alzheimer’s disease dementia using the National Health Information Database (NHID) managed by the National Health Insurance Service (NHIS) in South Korea. This nationwide database, initiated in 2000, accumulates extensive health screening data for Korean adults aged 40 years and older, capturing diverse health metrics including self-reported lifestyle questionnaires, physical examinations, and laboratory findings. To ensure robust and stable quantification of health behaviors, chronic comorbidities, and functional impairments, we selected a well-defined cohort of individuals who underwent three consecutive biennial health screenings over a 6-year baseline period. Utilizing a subsequent 10-year longitudinal follow-up, we estimated the long-term risk of Alzheimer’s disease dementia attributable to specific modifiable risk factors, with detailed stratification by sex and age groups. Notably, by linkable integration with the National Cancer Screening Program database, we successfully ascertained individual educational attainment—a well-established proxy for cognitive reserve and a key confounding factor [19,20]—thereby allowing a comprehensive array of dementia risk factors to be included in our analysis.
Methods
Data source and studypopulation
This nationwide retrospective cohort study was conducted using customized data provided by the National Health Insurance Service (NHIS) of Korea, which covers the entire Korean population. The NHIS database includes eligibility records, health screening results, healthcare utilization claims, and mortality information.
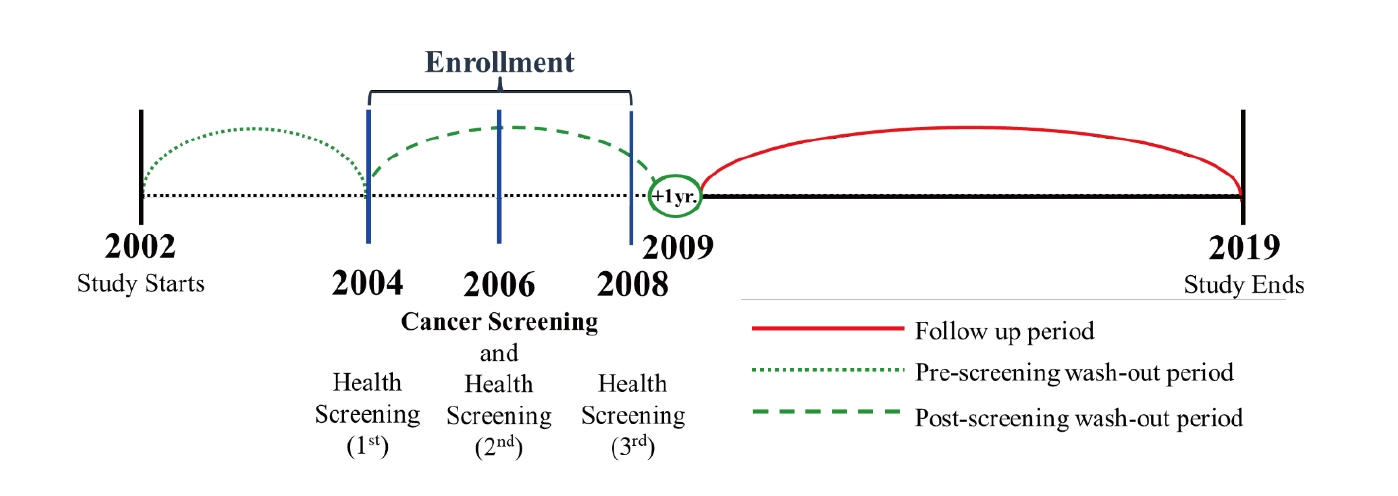
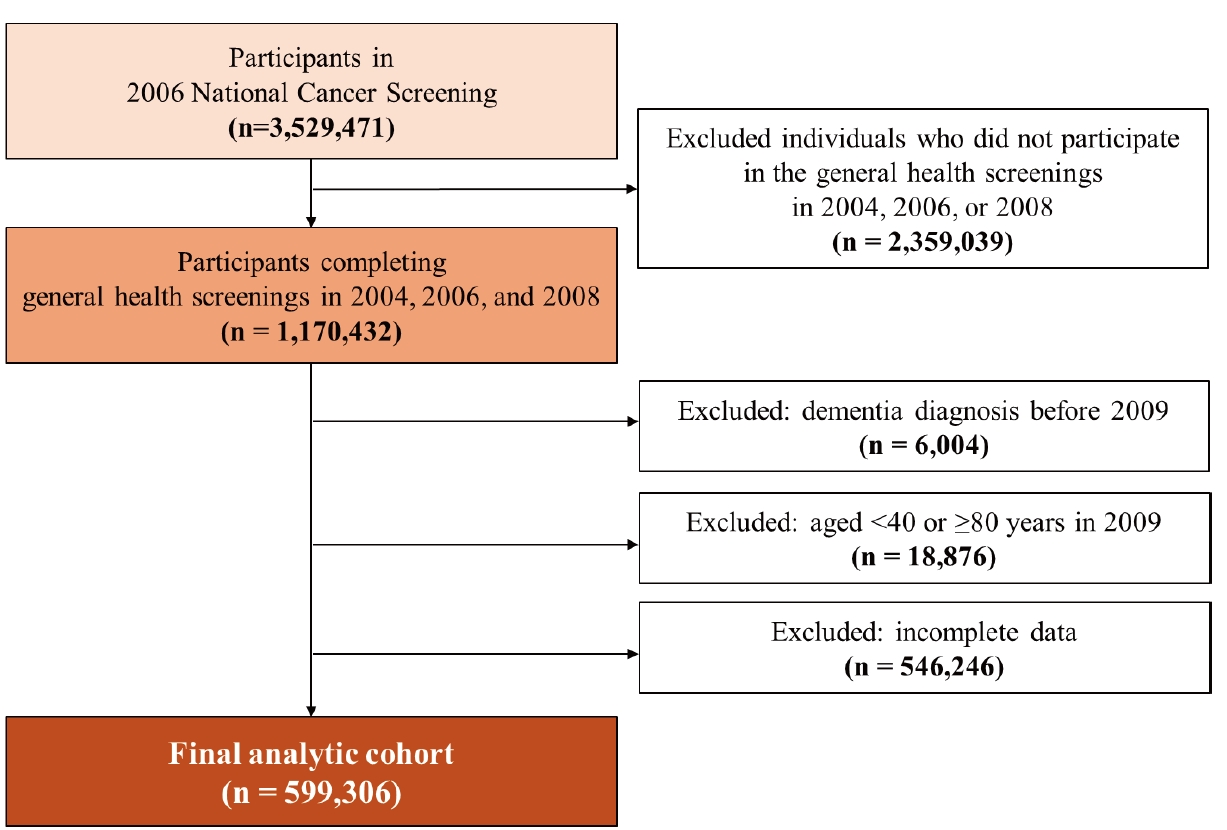
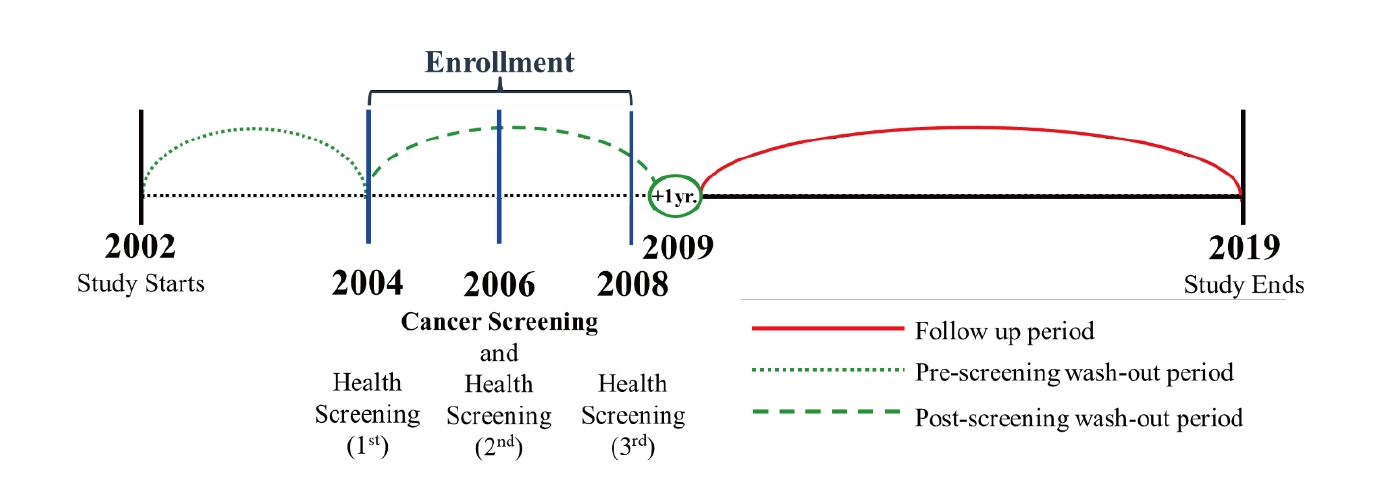
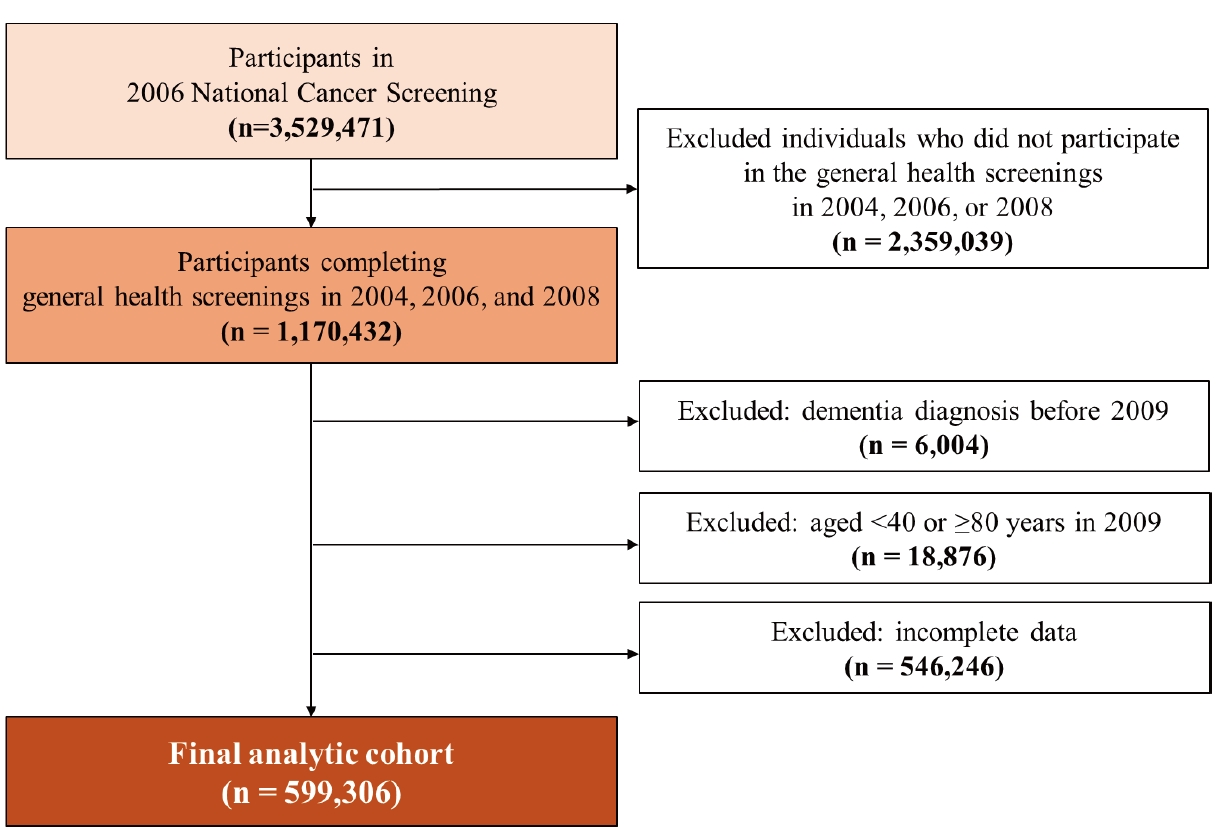
Among 3,529,471 individuals who participated in the 2006 National Cancer Screening Program, we identified 1,170,432 individuals who additionally underwent general health examinations in 2004, 2006, and 2008. To ensure temporal ordering between exposure changes and dementia onset, we applied both pre-screening and post-screening wash-out periods. To exclude prevalent dementia cases, individuals who diagnosed with dementia before January 1, 2009 were excluded (n = 6,004). Second, those aged <40 or ≥80 years at baseline in 2009 (n = 18,876) were excluded. Finally, participants with missing values in any screening variables were excluded (n = 546,246), resulting in a final analytic cohort of 599,306 individuals.
Follow-up and outcome ascertainment
The period from 2002 to the first health examination in 2004 was defined as the pre-screening wash-out period to exclude individuals with prior dementia diagnosis. To account for the latency between risk factor modification and dementia onset, a one-year post-screening washout period (2009), extending from the date of the participant's last health screening examination, was applied. Dementia cases diagnosed during this period were excluded to minimize reverse causation (Fig. 1). Participants were followed from January 1, 2009, until the first diagnosis of Alzheimer’s disease dementia, death, or December 31, 2019, whichever occurred first. Alzheimer’s disease dementia was defined using ICD-10 codes F00 or G30 recorded as primary or secondary diagnoses; additional operational criteria should be specified if prescription or repeated-claim information was used (Fig. 2).
Definition of risk factors and outcome ascertainment
Health behavior factors previously identified as risk factors for dementia—including smoking, high-risk alcohol consumption, physical inactivity, and obesity—were included in the analysis. In addition, chronic conditions such as diabetes mellitus, hypertension, and depression, as well as disability including hearing loss, visual loss, and physical disability. And traumatic brain injury was incorporated. Furthermore, sociodemographic variables, including sex, age, educational attainment and health insurance premium quantile as income, were added to the model. In total, 16 risk factors were included in the final analysis.
Incident Alzheimer’s disease dementia was ascertained between 2010 and 2019 using claims-based ICD-10 diagnosis codes F00 or G30 listed as a primary or secondary diagnosis.
Some dementia cases cannot be unequivocally attributed to a single etiologic subtype. In particular, in patients with Alzheimer’s disease who exhibit concomitant cerebrovascular pathology, the National Institute of Neurological Disorders and Stroke–Association Internationale pour la Recherche et l’Enseignement en Neurosciences (NINDS-AIREN) criteria recommend classifying such cases as Alzheimer’s disease with cerebrovascular disease (AD with CVD), rather than applying the nonspecific term ‘mixed dementia’, which has been widely used but lacks standardized diagnostic definition [21]. In accordance with this recommendation, when individuals met diagnostic criteria for both Alzheimer’s disease dementia and vascular dementia, priority was assigned to Alzheimer’s disease dementia in the present study to ensure mutually exclusive subtype classification.
Statistical analysis and development of the risk prediction model
Cox proportional hazards regression models were used to estimate hazard ratios (HRs) and 95% confidence intervals (CIs) for incident dementia. All 16 risk factors were simultaneously included in multivariable models to estimate independent associations.
The study population was stratified by sex (males and females) and subsequently by age at baseline in 2009 (<55 years and ≥ 55 years). The baseline year of 2009 was specifically designated so that participants would reach the ages of either <65 or ≥ 65 years by the end of the follow-up period in 2019. This stratification strategy was implemented to adjust for the confounding effects of age and to effectively distinguish between developing before age 65 (Early Onset Alzheimer’s Dementia; EOAD) and developing at or after age 65(Late-Onset Alzheimer’s Dementia; LOAD) during the follow-up period [22].
Results
General characteristics
The final analytic cohort included 599,306 participants. Baseline characteristics differed by sex in sociodemographic factors and health behaviors (Table 1).
Of the 599,306 total participants, 263,273 were male and 336,033 were female. At baseline in 2009, the mean age was 56.27±9.2 years for males and 55.94±8.6 years for females. In the 5-year age group analysis, the 45∼49 cohort was the most prevalent in both sexes (males: 21.4%, females: 23.6%), whereas the ≥ 75 cohort was the least prevalent (males: 4.4%, females: 3.3%).
Regarding socioeconomic status, females were characterized by lower income and lower educational attainment than males. The proportion in the lowest income quantile (Medical Aid & 1Q) was 10.6% for males versus 20.1% for females, while the highest quantile (4Q) accounted for 49.7% of males and 41.7% of females. Similarly, the prevalence of being unschooled was lower in males (2.7% vs. 7.2%), whereas high school graduation was higher (33.8% vs. 30.9%). For marital status, the proportion of those who were divorced, widowed, or separated was substantially lower in males than in females (3.2% vs. 11.1%).
Health behavior profiles exhibited prominent sex-specific disparities. The current smoking rate was 34.3% among males compared with only 1.5% among females, while 97.5% of females were non-smokers. Heavy drinking was observed in 15.6% of males and 2.8% of females. In addition, 57.4% of males engaged in physical activity ≥1 times/week, compared with 45.3% of females. The prevalence of underweight was 1.9% in males and 2.5% in females.
Regarding chronic comorbidities, diabetes (12.8% vs. 9.1%) and hypertension (40.5% vs. 31.9%) were more prevalent in males, whereas dyslipidemia (42.9% vs. 45.2%) and depression (3.0% vs. 5.7%) were more frequent in females. For injuries and sensory/physical impairments, males showed a higher prevalence across all categories: traumatic brain injury (0.7% vs. 0.4%), visual loss (3.5% vs. 1.4%), hearing loss (0.6% vs. 0.2%), and physical disability (0.4% vs. 0.2%).
Overall, substantial differences between sexes were observed primarily in health behaviors, with standardized mean differences (SMDs) exceeding 0.8 (smoking: SMD = 1.39; alcohol: SMD = 1.11). In contrast, differences in age, income, education, marital status, physical activity, chronic diseases, and impairments were minimal, with all SMDs remaining below 0.5.
Risk of alzheimer’s dementia
Males
Dementia risk factor profiles in males showed distinct variations between early-onset dementia (EOAD) and late-onset dementia (LOAD) (Table 2). Sociodemographically, the risk of dementia increased sequentially for every 5-year age increment in both subtypes. Lower income (Medical Aid & 1Q) significantly elevated the risk of EOAD (hazard ratio [HR] = 1.54, 95% confidence interval [CI]: 1.13–2.10), whereas lower educational attainment was consistently and significantly associated with an increased risk of LOAD across all education levels (e.g., Unschooled: HR = 1.52, 95% CI: 1.40–1.66). Although individuals without a spouse (divorced/widowed/separated) tended to increase EOAD risk, it was not statistically significant (HR = 1.11, P = 0.56).
Among health behaviors, current smoking (HR = 1.19, 95% CI: 1.13–1.24) and physical inactivity (HR = 1.12, 95% CI: 1.08–1.17) significantly increased LOAD risk, but not EOAD risk. Being underweight did not reach statistical significance for either EOAD (HR = 1.77, P = 0.06) or LOAD (HR = 1.14, P = 0.02).
For chronic comorbidities and impairments, both diabetes and depression significantly increased dementia risk across all age groups. Notably, depression was a remarkably potent risk factor for EOAD (HR = 3.61, 95% CI: 2.63–4.96) and remained significant for LOAD (HR = 1.52, 95% CI: 1.41–1.64). Traumatic brain injury (TBI) significantly elevated the risk of EOAD (HR = 2.52, 95% CI: 1.30–4.90) and LOAD (HR = 1.54, 95% CI 1.33-1.79). Conversely, hearing loss and physical disability were significant risk factors for LOAD. In contrast, visual loss was not significantly associated with dementia risk in males. The C-statistics for the male models were 0.6784 for EOAD and 0.7803 for LOAD, respectively.
Females
In females, risk profiles also demonstrated substantial differences between EOAD and LOAD (Table 2). For sociodemographic factors, a 5-year age increment consistently doubled the risk of both subtypes. Lower education levels significantly increased the risk of both conditions, with a more pronounced, graded relationship in LOAD (Unschooled: HR = 1.84, 95% CI: 1.69–2.00). Notably, the absence of a spouse was significantly associated with a decreased risk of LOAD (HR = 0.95, 95% CI: 0.92–0.98).
Regarding health behaviors, current smoking increased the risk of both EOAD (HR = 1.46, 95% CI: 0.99–2.14) and LOAD (HR = 1.26, 95% CI: 1.14–1.38). Physical inactivity significantly elevated the risk for both EOAD (HR = 1.22, 95% CI: 1.08–1.38) and LOAD (HR = 1.12, 95% CI: 1.08–1.15). Being underweight significantly increased LOAD risk (HR = 1.25, 95% CI: 1.14–1.38), whereas obesity was protective against LOAD (HR = 0.91, 95% CI: 0.84–0.99).
Among comorbidities and impairments, diabetes and depression significantly elevated the risk for both EOAD and LOAD, with depression showing a significant risk in EOAD (HR = 1.83, 95% CI: 1.46–2.29). For disabilities, physical disability (HR = 2.34, 95% CI: 1.56–3.51) and hearing loss (HR = 2.93, 95% CI: 1.10–7.84) were significant risk factor uniquely for EOAD. Conversely, TBI (HR = 1.25, 95% CI: 1.05–1.50), physical disability (HR = 1.19, 95% CI 1.09-1.30), and visual loss (HR = 1.27, 95% CI: 1.05–1.54) were associated with an increased risk for LOAD. The C-statistics for the female models were 0.6857 for EOAD and 0.7772 for LOAD, respectively.
Discussion
The risk of dementia associated with modifiable risk factors exhibited distinct sex- and age-specific characteristics. Regarding socioeconomic status, lower educational attainment and lower income levels were robustly associated with an increased risk of dementia across all sexes and age groups. Furthermore, while cohabitation with a spouse is conventionally reported as a protective factor against dementia across diverse cultural backgrounds [23], our study revealed a notable sex-based divergence: the absence of a spouse elevated dementia risk in males but lowered it in females. This discrepancy suggests that a spouse functions differently between sexes as a mediator of social contact—such as connections with family, friends, and neighbors. It may also reflect sex differences in marital satisfaction, spousal caregiving burdens, and marital conflict.
In terms of health behaviors, current smoking and physical inactivity were associated with a significantly increased risk of dementia in both sexes. With respect to body mass index (BMI), numerous studies have reported that obesity (BMI ≥ 30 kg/m²) is associated with an elevated risk of dementia [24]. In contrast, our findings identified underweight status (BMI < 18.5 kg/m²) as a significant risk factor for dementia [25,26]. This finding is consistent with recent domestic and international cohort studies demonstrating the adverse health consequences and increased dementia risk associated with being underweight. Notably, these studies have suggested that the association becomes more pronounced with advancing age.
Among chronic comorbidities, diabetes, hypertension, and depression consistently increased dementia risk in both sexes. Notably, depression emerged as the most potent risk factor, exhibiting the highest hazard ratio among all examined variables. Furthermore, the presence of traumatic brain injury (TBI), visual loss, hearing loss, or physical disability consistently elevated dementia risk regardless of sex. Rather than the disability itself directly driving the pathogenesis, this association is likely mediated by disability-induced reductions in physical activity and increased social isolation. For hearing loss, psychosocial factors such as loneliness, depression, and social isolation caused by hearing impairment have been continuously implicated [27]. Mechanistically, this is primarily explained by a neuropathological interplay: decreased external sensory stimulation leads to a reduction in cognitive reserve, while the compensatory need for increased cognitive resources during listening tasks further taxes the brain.
This study has several limitations. First, the broad definition of dementia used in this study may have resulted in the inclusion of individuals who were overdiagnosed or misclassified as having dementia. Differences in the definition of dementia cases across studies have led to substantial variation in estimates of dementia prevalence and incidence [28,29]. Even when examining all-cause dementia, researchers have applied different diagnostic codes, varied the inclusion of primary and secondary diagnoses, and adopted different healthcare utilization criteria, such as requiring only outpatient visits or additionally considering dementia-related medication use. In this study, individuals were classified as having Alzheimer's disease dementia if they had at least one outpatient visit with a diagnosis of Alzheimer's disease dementia (ICD-10 codes F00 or G30) during the follow-up period. Both primary and secondary diagnoses were considered without distinction. This broad case definition was adopted for several reasons. First, the primary objective of this study was to investigate the association between dementia risk factors and subsequent dementia incidence. Therefore, it was considered appropriate to include not only patients with Alzheimer's disease dementia but also individuals at high risk of dementia, such as those with mild cognitive impairment. Second, continued healthcare utilization may not occur even after a dementia diagnosis because of factors such as therapeutic nihilism regarding the perceived untreatability of dementia and the social stigma associated with a dementia diagnosis, both of which may discourage ongoing medical care [30,31]. Third, given the irreversible neuropathological changes characteristic of Alzheimer's disease dementia, a single healthcare encounter with an Alzheimer's disease dementia diagnosis is likely to represent a true dementia case. Nevertheless, the use of a broad diagnostic definition may have increased the possibility of outcome misclassification, and the findings should therefore be interpreted with caution. Future studies employing more stringent diagnostic criteria, including repeated healthcare encounters, medication records, or clinically validated diagnoses, are warranted to confirm the robustness of the observed associations.
A second limitation of this study relates to the age classification strategy. Participants were categorized as either younger than 55 years or 55 years and older at baseline (2009), the start of follow-up. This classification was intended to distinguish dementia cases that occurred during the follow-up period into early-onset Alzheimer's disease (EOAD) and late-onset Alzheimer's disease (LOAD), based on whether participants would be younger than 65 years or 65 years and older, respectively, by the end of follow-up in 2019.
This dichotomization at 55 years may have introduced some degree of misclassification, particularly for individuals near the cutoff point, who could have been assigned to different age groups despite having similar underlying risk profiles. Consequently, the effect of age on dementia risk may have been amplified, whereas the relative contributions of other risk factors may have been attenuated. Nevertheless, stratifying participants into EOAD and LOAD groups allowed us to better capture the potentially nonlinear relationship between age and dementia risk, improved adherence to the proportional hazards assumption, and enhanced the clinical interpretability and applicability of the findings. Therefore, we considered the distinction between EOAD and LOAD to be appropriate for addressing the objectives of this study.
Conclusions
The risk of dementia associated with specific risk factors exhibited distinct sex- and age-specific characteristics. Consequently, tailored approaches encompassing both individualized prevention planning and population-level risk reduction strategies are warranted to effectively mitigate the growing burden of dementia.
Notes
Conflict of Interest
Hyun Jung Kim has been a editor of Journal of Evidence-Based Practice since 2025. However, she was not involved in the peer reviewer selection, evaluation, or decision process of this article. No other potential conflicts of interest relevant to this article were reported.
Funding
This work was not directly funded.
Data Availability Statement
The data that support the findings of this study are available from the Korean National Health Insurance Service (NHIS) but restrictions apply to the availability of these data, which were used under license for the current study. Data are available from the authors upon reasonable request and with permission of NHIS.
Ethics Approval and Consent to Participate
The study protocol was approved by the Institutional Review Board (IRB No. E-2411-131-1590) and the National Health Information Data Review Committee of the National Health Insurance Service (Research Management No. REQ2025010906-006). The requirement for informed consent was waived because all data were fully anonymized prior to analysis.
We thank the Korea NHIS for providing the database used in this study.
Fig. 1.
Framework of the follow up period.
Fig. 2.
Process of study sample selection.
Table 1.
General Characteristics of Study Population
Variables
Male(N=263,273)
Female(N=336,033)
SMD*
N
%
N
%
Mean Age(‘09)
56.27±9.2
55.94±8.6
0.03804
Age group(years old)
40∼44
18,658
7.1
16,976
5.1
0.15055
45∼49
56,331
21.4
79,263
23.6
50∼54
52,888
20.1
63,441
18.9
55∼59
50,250
19.1
76,221
22.7
60∼64
30,577
11.6
39,967
11.9
65∼69
24,320
9.2
30,081
9.0
70∼74
18,589
7.1
19,115
5.7
≥ 75
11,660
4.4
10,969
3.3
Income
Medical Aid & 1Q (low)
27,972
10.6
67,708
20.1
0.28105
2Q
38,391
14.6
53,447
15.9
3Q
66,134
25.1
74,613
22.2
4Q (high)
130,776
49.7
140,265
41.7
Education
Unschooled
7,172
2.7
24,143
7.2
0.45373
Elementary School
29,903
11.4
70,748
21.1
Middle School
36,487
13.9
61,860
18.4
High School
88,901
33.8
103,719
30.9
College student or higher
100,810
38.3
75,563
22.5
Spouse
Yes
249,352
94.7
290,990
86.6
0.28116
No
13,921
5.3
45,043
13.4
Smoking
None smoker
121,966
46.3
327,778
97.5
1.38728
Former smoker
51,117
19.4
3,287
1.0
Current smoker
90,190
34.3
4,968
1.5
Alcohol
Non-drinker
90,448
34.4
275,451
82.0
1.10817
Moderate drinker
131,841
50.1
51,283
15.3
Heavy drinker
40,984
15.6
9299
2.8
Physical Activity
< 1 time/week
112,091
42.6
183,762
54.7
0.24408
≥ 1 times/week
151,182
57.4
152,271
45.3
BMI
Normal weight & Obesity
258,231
98.1
327,666
97.5
0.03917
Underweight
5,042
1.9
8,367
2.5
Diabetes
Normal
229,624
87.2
305,593
90.9
0.11956
Diabetes
33,649
12.8
30,440
9.1
Hypertension
Normal
156,536
59.5
228,751
68.1
0.17998
Hypertension
106,737
40.5
107,282
31.9
Dyslipidemia
Normal
150,321
57.1
184,259
54.8
0.04561
Dyslipidemia
112,952
42.9
151,774
45.2
Depression
Normal
255,466
97.0
316,809
94.3
0.13550
Depression
7,807
3.0
19,224
5.7
TBI
None
261,480
99.3
334,820
99.6
0.04447
TBI
1,793
0.7
1213
0.4
Visual loss
None
254,115
96.5
331,387
98.6
0.13642
Visual loss
9,158
3.5
4,646
1.4
Hearing loss
None
261,793
99.4
335,232
99.8
0.05130
Hearing loss
1,480
0.6
801
0.2
Physical Disability
None
262,174
99.6
335,467
99.8
0.04609
Physical Disability
1,099
0.4
566
0.2
SMD, standard mean difference; BMI, body mass index; DM, diabetes mellitus; TBI, traumatic brain injury.
Table 2.
Age-Specific Risk of Alzheimer’S Dementia by Risk Factors
Variables
Male
Female
EOAD
LOAD
EOAD
LOAD
HR
P
95% CI
HR
P
95% CI
HR
P
95% CI
HR
P
95% CI
Age group(years old)
40∼44
1.00
-
ref.
1.00
-
ref.
45∼49
2.01
0.00
(1.33-3.04)
2.42
0.00
(1.63-3.58)
50∼54
3.84
0.00
(2.56-5.76)
5.06
0.00
(3.42-7.49)
55∼59
1.00
-
ref.
1.00
-
ref.
60∼64
2.53
0.00
(2.33-2.75)
2.24
0.00
(2.12-2.38)
65∼69
5.39
0.00
(4.99-5.82)
4.89
0.00
(4.63-5.16)
70∼74
10.30
0.00
(9.56-11.10)
9.14
0.00
(8.66-9.65)
≥ 75
17.26
0.00
(15.99-18.63)
14.30
0.00
(13.52-15.14)
Income
Medical Aid & 1Q
1.54
0.01
(1.13-2.10)
1.07
0.02
(1.01-1.13)
0.77
0.00
(0.64-0.92)
1.10
0.00
(1.06-1.15)
2Q
1.13
0.39
(0.85-1.50)
1.12
0.00
(1.06-1.18)
1.08
0.39
(0.90-1.30)
1.13
0.00
(1.08-1.17)
3Q
1.12
0.31
(0.90-1.39)
1.09
0.00
(1.04-1.15)
1.18
0.04
(1.01-1.39)
1.05
0.02
(1.01-1.09)
4Q
1.00
-
ref.
1.00
-
ref.
1.00
-
ref.
1.00
-
ref.
Education
Unschooled
1.49
0.23
(0.77-2.88)
1.52
0.00
(1.40-1.66)
1.43
0.04
(1.01-2.03)
1.84
0.00
(1.69-2.00)
Elementary School
2.06
0.00
(1.48-2.87)
1.48
0.00
(1.39-1.57)
2.01
0.00
(1.62-2.50)
1.64
0.00
(1.52-1.78)
Middle School
1.47
0.01
(1.10-1.96)
1.26
0.00
(1.18-1.34)
1.88
0.00
(1.55-2.27)
1.41
0.00
(1.30-1.53)
High School
1.02
0.84
(0.83-1.26)
1.19
0.00
(1.12-1.26)
1.31
0.00
(1.10-1.55)
1.29
0.00
(1.18-1.40)
College student or higher
1.00
-
ref.
1.00
-
ref.
1.00
-
ref.
1.00
-
ref.
Spouse
Yes
1.00
-
ref.
1.00
-
ref.
1.00
-
ref.
1.00
-
ref.
No
1.11
0.56
(0.78-1.58)
1.05
0.23
(0.97-1.13)
1.12
0.24
(0.92-1.37)
0.95
0.00
(0.92-0.98)
Smoking
None smoker
1.00
-
ref.
1.00
-
ref.
1.00
-
ref.
1.00
-
ref.
Former smoker
0.91
0.47
(0.70-1.18)
1.05
0.06
(1.00-1.10)
0.96
0.90
(0.53-1.75)
1.26
0.00
(1.09-1.45)
Current smoker
1.19
0.09
(0.97-1.45)
1.19
0.00
(1.13-1.24)
1.46
0.06
(0.99-2.14)
1.26
0.00
(1.14-1.38)
Alcohol
Non-drinker
1.00
-
ref.
1.00
-
ref.
1.00
-
ref.
1.00
-
ref.
Moderate drinker
0.81
0.04
(0.66-0.99)
0.89
0.00
(0.85-0.92)
0.99
0.87
(0.84-1.15)
0.99
0.64
(0.94-1.04)
Heavy drinker
0.89
0.41
(0.67-1.18)
1.01
0.84
(0.96-1.06)
1.31
0.06
(0.99-1.73)
1.08
0.17
(0.97-1.20)
Physical Activity
< 1 times/week
0.97
0.74
(0.81-1.16)
1.12
0.00
(1.08-1.17)
1.22
0.00
(1.08-1.38)
1.12
0.00
(1.08-1.15)
≥ 1 times/week
1.00
-
ref.
1.00
-
ref.
1.00
-
ref.
1.00
-
ref.
BMI†
Underweight
1.77
0.06
(0.97-3.23)
1.14
0.02
(1.02-1.27)
0.92
0.70
(0.61-1.39)
1.25
0.00
(1.14-1.38)
Normal weight
1.00
-
ref.
1.00
-
ref.
1.00
-
ref.
1.00
-
ref.
Obesity
0.73
0.36
(0.38-1.42)
1.03
0.70
(0.89-1.20)
0.86
0.49
(0.55-1.33)
0.91
0.02
(0.84-0.99)
Diabetes
Normal
1.00
-
ref.
1.00
-
ref.
1.00
-
ref.
1.00
-
ref.
Diabetes
1.79
0.00
(1.40-2.29)
1.38
0.00
(1.33-1.45)
1.51
0.00
(1.19-1.93)
1.35
0.00
(1.31-1.40)
Hypertension
Normal
1.00
-
ref.
1.00
-
ref.
1.00
-
ref.
1.00
-
ref.
Hypertension
1.08
0.41
(0.90-1.30)
1.07
0.00
(1.03-1.12)
1.02
0.75
(0.88-1.19)
1.06
0.00
(1.03-1.09)
Dyslipidemia
Normal
1.00
-
ref.
1.00
-
ref.
1.00
-
ref.
1.00
-
ref.
Dyslipidemia
1.10
0.31
(0.92-1.31)
1.02
0.32
(0.98-1.06)
1.07
0.26
(0.95-1.21)
1.01
0.41
(0.98-1.05)
Depression
Normal
1.00
-
ref.
1.00
-
ref.
1.00
-
ref.
1.00
-
ref.
Depression
3.61
0.00
(2.63-4.96)
1.52
0.00
(1.41-1.64)
1.83
0.00
(1.46-2.29)
1.56
0.00
(1.49-1.63)
TBI
None
1.00
-
ref.
1.00
-
ref.
1.00
-
ref.
1.00
-
ref.
TBI
2.52
0.01
(1.30-4.90)
1.54
0.00
(1.33-1.79)
0.84
0.76
(0.27-2.61)
1.25
0.01
(1.05-1.50)
Physical Disability
None
1.00
-
ref.
1.00
-
ref.
1.00
-
ref.
1.00
-
ref.
Physical Disability
1.44
0.09
(0.95-2.18)
1.20
0.00
(1.11-1.30)
2.34
0.00
(1.56-3.51)
1.19
0.00
(1.09-1.30)
Visual loss
None
1.00
-
ref.
1.00
-
ref.
1.00
-
ref.
1.00
-
ref.
Visual loss
0.99
0.99
(0.25-3.99)
1.14
0.14
(0.96-1.36)
1.48
0.58
(0.37-5.92)
1.27
0.01
(1.05-1.54)
Hearing loss
None
1.00
-
ref.
1.00
-
ref.
1.00
-
ref.
1.00
-
ref.
Hearing loss
1.57
0.53
(0.39-6.31)
1.34
0.00
(1.13-1.59)
2.93
0.03
(1.10-7.84)
1.21
0.11
(0.96-1.54)
C-statistics
0.6784
0.7803
0.6857
0.7772
References
1. World Health Organization. The ICD-10 classification of mental and behavioural disorders: clinical descriptions and diagnostic guidelines. Geneva, WHO. 1992.
2. Morris JC. The Clinical Dementia Rating (CDR): current version and scoring rules. Neurology 1993; 43: 2412-4.
3. Ministry of Health and Welfare, National Institute of Dementia. Korean nationwide dementia epidemiology and status survey 2023. Sejong, Ministry of Health and Welfare. 2025.
4. Avan A, Hachinski V. Global, regional, and national trends of dementia incidence and risk factors, 1990-2019: A Global Burden of Disease study. Alzheimers Dement 2023; 19: 1281-91.
8. Hwang PH, Ang TFA, De Anda-Duran I, Liu X, Liu Y, Gurnani A, et al. Examination of potentially modifiable dementia risk factors across the adult life course: The Framingham Heart Study. Alzheimers Dement 2023; 19: 2975-83.
9. Gottesman RF, Albert MS, Alonso A, Coker LH, Coresh J, Davis SM, et al. Associations Between Midlife Vascular Risk Factors and 25-Year Incident Dementia in the Atherosclerosis Risk in Communities (ARIC) Cohort. JAMA Neurol 2017; 74: 1246-54.
10. Raggi M, Dugravot A, Valeri L, Machado-Fragua MD, Dumurgier J, Kivimaki M, et al. Contribution of smoking towards the association between socioeconomic position and dementia: 32-year follow-up of the Whitehall II prospective cohort study. Lancet Reg Health Eur 2022; 23: 100516.
11. Wu S, Xu Y, Zheng R, Lu J, Li M, Chen L, et al. Hypertension Defined by 2017 ACC/AHA Guideline, Ideal Cardiovascular Health Metrics, and Risk of Cardiovascular Disease: A Nationwide Prospective Cohort Study. Lancet Reg Health West Pac 2022; 20: 100350.
13. Elias MF, Elias PK, Sullivan LM, Wolf PA, D'Agostino RB. Lower cognitive function in the presence of obesity and hypertension: the Framingham heart study. Int J Obes Relat Metab Disord 2003; 27: 260-8.
14. Hagger-Johnson G, Sabia S, Brunner EJ, Shipley M, Bobak M, Marmot M, et al. Combined impact of smoking and heavy alcohol use on cognitive decline in early old age: Whitehall II prospective cohort study. Br J Psychiatry 2013; 203: 120-5.
15. Whitmer RA, Sidney S, Selby J, Johnston SC, Yaffe K. Midlife cardiovascular risk factors and risk of dementia in late life. Neurology 2005; 64: 277-81.
17. Kimm H, Lee PH, Shin YJ, Park KS, Jo J, Lee Y, et al. Mid-life and late-life vascular risk factors and dementia in Korean men and women. Arch Gerontol Geriatr 2011; 52: e117-22.
18. Son SK. Analysis of the risk of dementia associated with diabetes mellitus in the Korean elderly population [master's thesis]. Seoul, Korea University; 2020.
19. Sharp ES, Gatz M. Relationship between education and dementia: an updated systematic review. Alzheimer Dis Assoc Disord 2011; 25: 289-304.
20. Norton S, Matthews FE, Barnes DE, Yaffe K, Brayne C. Potential for primary prevention of Alzheimer's disease: an analysis of population-based data. Lancet Neurol 2014; 13: 788-94.
21. Román GC, Tatemichi TK, Erkinjuntti T, Cummings JL, Masdeu JC, Garcia JH, et al. Vascular dementia: diagnostic criteria for research studies. Report of the NINDS-AIREN International Workshop. Neurology 1993; 43: 250-60.
23. Sommerlad A, Ruegger J, Singh-Manoux A, Lewis G, Livingston G. Marriage and risk of dementia: systematic review and meta-analysis of observational studies. J Neurol Neurosurg Psychiatry 2018; 89: 231-8.
24. Albanese E, Launer LJ, Egger M, Prince MJ, Giannakopoulos P, Wolters FJ, et al. Body mass index in midlife and dementia: Systematic review and meta-regression analysis of 589,649 men and women followed in longitudinal studies. Alzheimers Dement (Amst) 2017; 8: 165-78.
25. Wang C, Fu W, Cao S, Jiang H, Guo Y, Xv H, et al. Weight Loss and the Risk of Dementia: A Meta-analysis of Cohort Studies. Curr Alzheimer Res 2021; 18: 125-35.
26. Cho SH, Jang M, Ju H, Kang MJ, Yun JM, Yun JW. Association of late-life body mass index with the risk of Alzheimer disease: a 10-year nationwide population-based cohort study. Sci Rep 2022; 12: 15298.
28. Jang JW, Park JH, Kim S, Lee SH, Lee SH, Kim YJ. Prevalence and Incidence of Dementia in South Korea: A Nationwide Analysis of the National Health Insurance Service Senior Cohort. J Clin Neurol 2021; 17: 249-56.
29. Hwangbo S, Lee JY, Han G, Chun MY, Jang H, Seo SW, et al. Dementia incidence and population-attributable fraction for dementia risk factors in Republic of Korea: a 12-year longitudinal follow-up study of a national cohort. Front Aging Neurosci 2023; 15: 1126587.
30. Handels R, Jönsson L, Garcia-Ptacek S, Eriksdotter M, Wimo A. Controlling for selective dropout in longitudinal dementia data: Application to the SveDem registry. Alzheimers Dement 2020; 16: 789-96.
31. Cox CG, Brush BL, Kobayashi LC, Roberts JS. Determinants of dementia diagnosis in U.S. primary care in the past decade: A scoping review. J Prev Alzheimers Dis 2025; 12: 100035.