This is an Open Access article distributed under the terms of the Creative Commons Attribution Non-Commercial License (http://creativecommons.org/licenses/by-nc/4.0/) which permits unrestricted non-commercial use, distribution, and reproduction in any medium, provided the original work is properly cited.
The COVID-19 pandemic triggered extensive global research, leading to an unprecedented surge in both peer-reviewed publications and preprints. Despite their widespread use, the implications of preprints for global diversity in scientific communication remain underexplored. This study evaluates how preprints influenced regional diversity in COVID-19 research by analyzing international collaboration networks, social media engagement, and citation patterns compared to peer-reviewed publications.
Methods
We conducted a comparative analysis of COVID-19-related peer-reviewed publications indexed in SCOPUS and preprints from MedRxiv (December 2019–November 2022). Regional diversity was evaluated using bibliometric metrics stratified by World Bank income classifications and geographic regions. International collaboration was quantified using network analysis metrics, while publication, dissemination, and social media engagement were assessed through relative ratios. Social media engagement was measured by quoted posts on X (formerly Twitter). Citation counts were compared between articles with preprint history versus those published directly in journals.
Results
Authors from Sub-Saharan Africa, Latin America, and the Caribbean showed 3.9–4.5 times higher eigenvector centrality in preprints than in peer-reviewed papers, indicating greater integration into global research networks through preprint platforms. Low-income countries showed higher representation in preprints (P<0.001). Although overall engagement on X was similar for both formats, preprints exhibited higher relative ratios of quoted posts across all income groups. Peer-reviewed articles with preprint history received more citations (median=10, 25th-75th percentiles: 3–30) than those without (median=3, 25th-75th percentiles: 0–11, P<0.001), especially from low- and middle-income countries.
Conclusions
Preprints significantly advanced regional diversity in scientific communication during the COVID-19 pandemic. Preprints enhanced international collaboration networks, particularly benefiting researchers from lower-income regions, facilitated broader social media engagement across all income groups, and conferred meaningful citation advantages for subsequent peer-reviewed publications. These results suggest that preprints represent an important mechanism for promoting more equitable participation in global scientific discourse.
The COVID-19 pandemic has triggered extensive research efforts worldwide, with a substantial body of work being produced to understand and combat the virus [1-5]. However, much of this research has been concentrated in high-income countries, leading to disparities in the geographical representation of scientific output. Despite the global nature of the pandemic, researchers from low- and middle-income countries (LMICs) have been underrepresented, further highlighting the existing inequities in the global research landscape.
In this context, preprints have gained attention as a potential solution to overcome the limitations of traditional peer-reviewed journals. The conventional academic publishing process often faces issues such as lengthy and complex review processes, high publication costs, and sometimes bias based on authors' affiliations or nationalities [6]. In contrast, preprints, which involve sharing preliminary manuscripts on public servers before formal peer review, offer advantages such as rapid feedback collection, idea prioritization, and improved access to research [7,8]. The use of preprints surged during the COVID-19 pandemic, particularly in medical research [2,9-11]. The preprint system enables swift dissemination of information in emergency situations, complementing the limitations of traditional publishing systems.
Although numerous preprints have been published via open server during this pandemic [12], little attention has been given to their implications for the inclusive science communication [13]. Meanwhile, social media tools are increasingly part of the research workflow, offering new dissemination and communication possibilities to researchers [14].
The aim of this study is to analyze the impact of COVID-19-related preprints and peer-reviewed papers on global scientific communication. Specifically, we assess the role of preprints in fostering more inclusive research practices by examining regional diversity in authorship, publication, and dissemination. Our analysis draws on data from both publication databases and social media (X, formerly Twitter) to compare the reach and engagement of preprints and peer-reviewed papers, with a focus on regional disparities.
Methods
Data collection
This study collected data from Scopus and medRxiv to assess regional diversity in scientific communication during COVID-19. Scopus is a peer-reviewed literature database, while medRxiv is a health sciences preprint repository [15]. COVID-19-related articles from December 1, 2019, to November 31, 2022, were collected using keywords such as “COVID-19”, “SARS-CoV-2”, and “coronavirus disease 2019” (Text S1) [1]. By April 20, 2023, metadata including titles, digital object identifiers (DOIs), and author affiliations were obtained, resulting in 277,366 papers from Scopus and 19,584 from medRxiv.
For regional analysis, the author’s affiliations were processed using the ‘hugofitipaldi/affiliation’ R package. X (formerly Twitter) data were integrated using Altmetric and the X/Twitter API, tracking posts linking to papers and categorizing users into demographic groups such as “public”, “researcher”, “practitioner”, and “science communicator”. Citation data were retrieved via the CrossRef API to compare citation counts between peer-reviewed papers with and without preprint history [16].
Regional and income-level categorization
For the analysis of regional and income-level diversity, country information was grouped based on the World Bank’s 2022 regional and income group classifications [17]. Income groups were defined as follows: low income (gross national income [GNI] per capita of $1,135 or less), lower-middle income ($1,136 to $4,465), upper-middle income ($4,466 to $13,845), and high income ($13,846 or more). Geographical regions were grouped according to the World Bank’s administrative classifications, including East Asia and Pacific, Europe and Central Asia, Latin America and the Caribbean, Middle East and North Africa, North America, South Asia, and Sub-Saharan Africa. To address previous findings that Europe and North America are often overrepresented in peer-reviewed journals, we distinguished Europe from Central Asia for clearer analysis.
Global co-authorship networks
To identify patterns of international collaboration between regions, the Inter-regional Co-authorship Count was defined to quantify the number of collaborative papers between researchers from different regions. This was calculated as follows:
Inter-regionalCo-authorshipCountij=∑k=1Nδik·δjk
where N represents the total number of papers, and δik and δjk indicate whether paper k has authors from regions i and j, respectively.
To evaluate the influence of each region, we used eigenvector centrality (EVC) and calculated the Co-authorship Enhancement Index (CEI), defined as:
CEIr=EVCpreprint,rEVCpeer-reviewed,r
This ratio indicates whether a region r was more central in the preprint network compared to the peer-reviewed network. Eigenvector centrality assigns scores to nodes (regions) based on their connections to influential nodes, weighted by normalized inter-regional co-authorship counts. This measure highlights which regions hold the most central and influential positions in global research collaboration, allowing us to compare the roles of regions in preprint versus peer-reviewed networks.
Publication of research
To analyze differences in publication between preprints and peer-reviewed articles across different regions, we calculated the Publication Relative Ratio (PubRR) for each country c.
PubRR represents the relative ratio of a country’s share of first authors preprints to its share in peer-reviewed papers. This ratio allows us to determine whether researchers in a country are more inclined to publish preprints compared to peer-reviewed articles.
Social media dissemination of research
To evaluate how research is disseminated on social media, we analyzed X posts of preprints and peer-reviewed papers. Social Media Quotation Count quantifies the number of X posts referencing papers from a country. A higher quotation count indicates broader dissemination of that country’s research on X.
where Pc represents the set of papers with first authors from country c.
Social Media Quotation Relative Ratio (QuoRR) compares the share of social media quotation count for preprints versus peer-reviewed articles for each country.
To understand how social media users engage with research, we used the Social Media Readership Relative Ratio (ReadRR). ReadRR measures the relative ratio of social media users citing preprints versus peer-reviewed articles from a particular country
To explore how the general public engages with research output in each country through social media, we calculated the Public Engagement Relative Ratio (PERR). PERR was used to assess whether public users engage more with preprints than peer-reviewed papers from a given country.
All relative ratios (PubRR, QuoRR, ReadRR, and PERR) are interpreted as follows:
■ Value > 1: greater engagement for preprints compared to peer-reviewed papers.
■ Value = 1: equal engagement.
■ Value < 1: lower engagement for preprints compared to peer-reviewed papers.
These metrics provide a comprehensive understanding of collaboration, publication, social media dissemination and user engagement across different regions during the COVID-19 pandemic.
Statistical analyses
The coefficient of variation (CV) for inter-regional co-authorship counts was calculated to assess variability in collaboration among regions. Pearson's correlation analyses were performed to examine the relationships between GDP and four relative ratio metrics. Scatter plots and R-squared values were used to visualize these relationships. The Wilcoxon signed-rank test was used to compare the median number of social media posts quoting preprints versus peer-reviewed papers within income groups. A two-sample proportion test was employed to compare the ratio of social media quotation counts to total paper counts across Scopus and medRxiv. Chi-squared tests were used to compare user demographics citing different publication types, and the Wilcoxon rank-sum test assessed citation differences between peer-reviewed papers with and without preprint versions.
Results
Data collection
We collected 15,413,656 X posts referencing 277,366 papers from Scopus and 2,718,034 X posts referencing 19,584 papers from medRxiv, authored by users from 201 and 213 countries, respectively. For regional diversity analysis, we categorized countries of first authors and X users by income level and geographical region, excluding entries without identifiable country information. The final categorization, which is shown in Fig. S1, included:
1. Country-classified Papers: We categorized papers based on the country of the first author for 250,442 Scopus papers (192 countries) and 13,952 medRxiv papers (147 countries) (Table S1).
2. Country-classified X Posts: We categorized X posts based on the country of the paper's first author (14,325,011 posts for Scopus and 1,853,738 for medRxiv) (Table S2A). Additionally, we categorized posts based on the users' country (5,910,665 posts for Scopus and 1,010,582 for medRxiv) (Table S2B).
Global co-authorship networks
Inter-regional co-authorship counts were calculated across 8 regions, resulting in 28 pairwise combinations for each data source. The average co-authorship count was 196,572.30 for Scopus and 6,833.64 for medRxiv, with a coefficient of variation (CV) of 2.70 for Scopus and 1.95 for medRxiv. This indicates a wider disparity in regional collaboration for peer-reviewed articles compared to preprints. Detailed matrix and counts provided in Fig. S2 and Table S3. The co-authorship enhancement index (CEI)—calculated as the ratio of EVC for preprints to peer-reviewed publications—was highest in North America (7.66), followed by Sub-Saharan Africa (4.53), Central Asia (4.29), Latin America & Caribbean (3.90), Middle East & North Africa (2.19), East Asia & Pacific (1.76), and South Asia (1.07), with Europe serving as the baseline (EVC = 1.00) (Table 1).
Publication of research
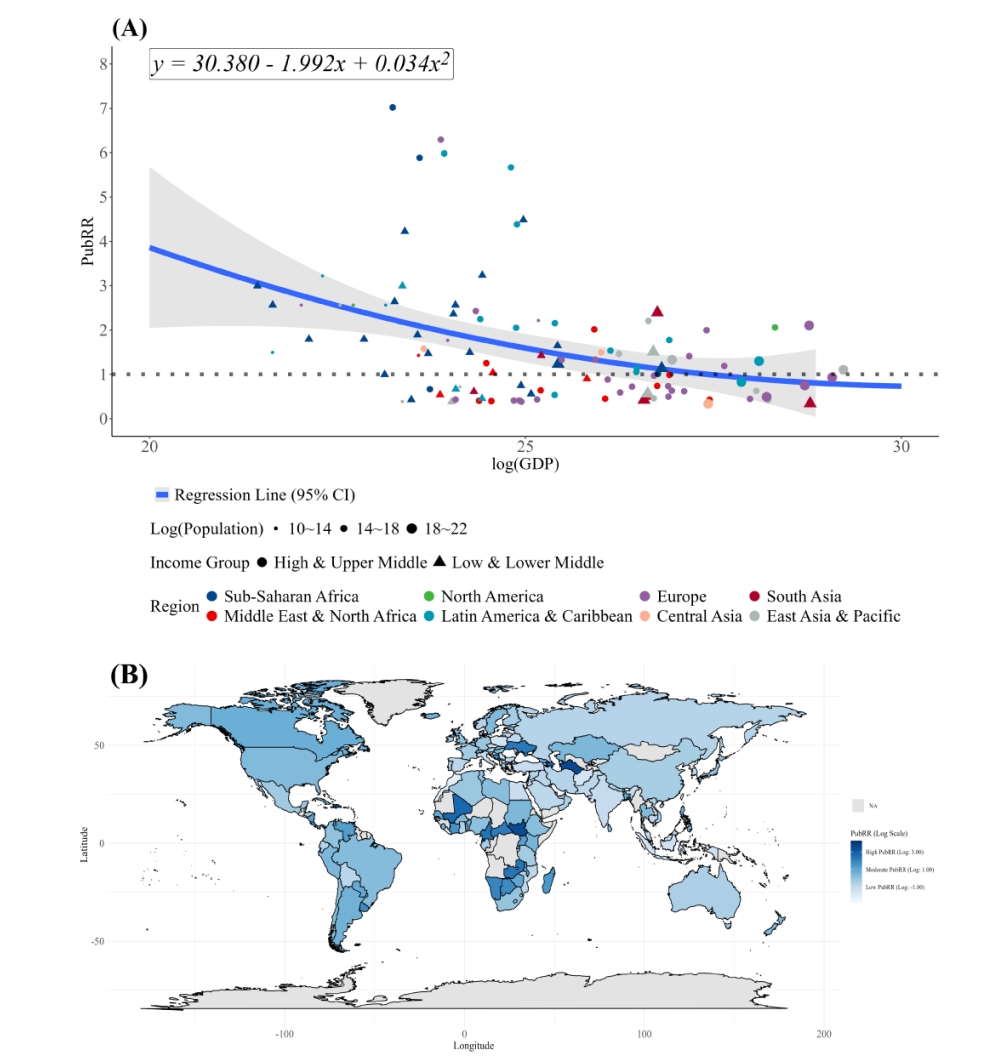
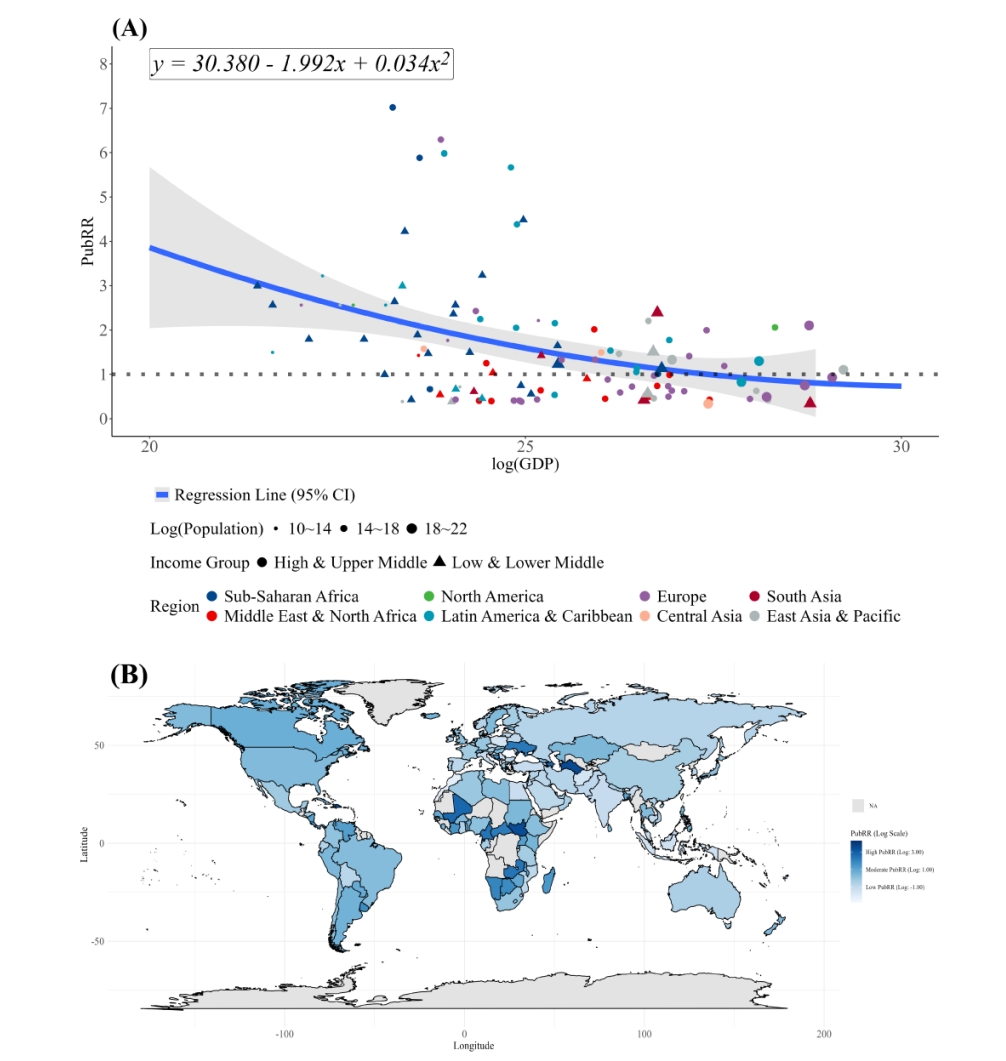
The Publication Relative Ratio (PubRR) was calculated to compare the number of papers authored by researchers from each country across Scopus and medRxiv. A significant negative correlation between PubRR and GDP was observed (Pearson correlation coefficient: -0.38, P value < 0.001), indicating that researchers from countries with lower GDPs are more likely to publish in preprint repositories (Fig. 1A). Over half of the countries in North America, Latin America, Central Asia, and Sub-Saharan Africa displayed PubRR values greater than 1 (Fig. 1B, Fig. S3). High PubRR values were recorded in countries such as Turkmenistan (35.9), South Sudan (33.3), Mali (15.9), Cameroon (11.2) and Ukraine (9.9) (Table S4).
Social media dissemination of research
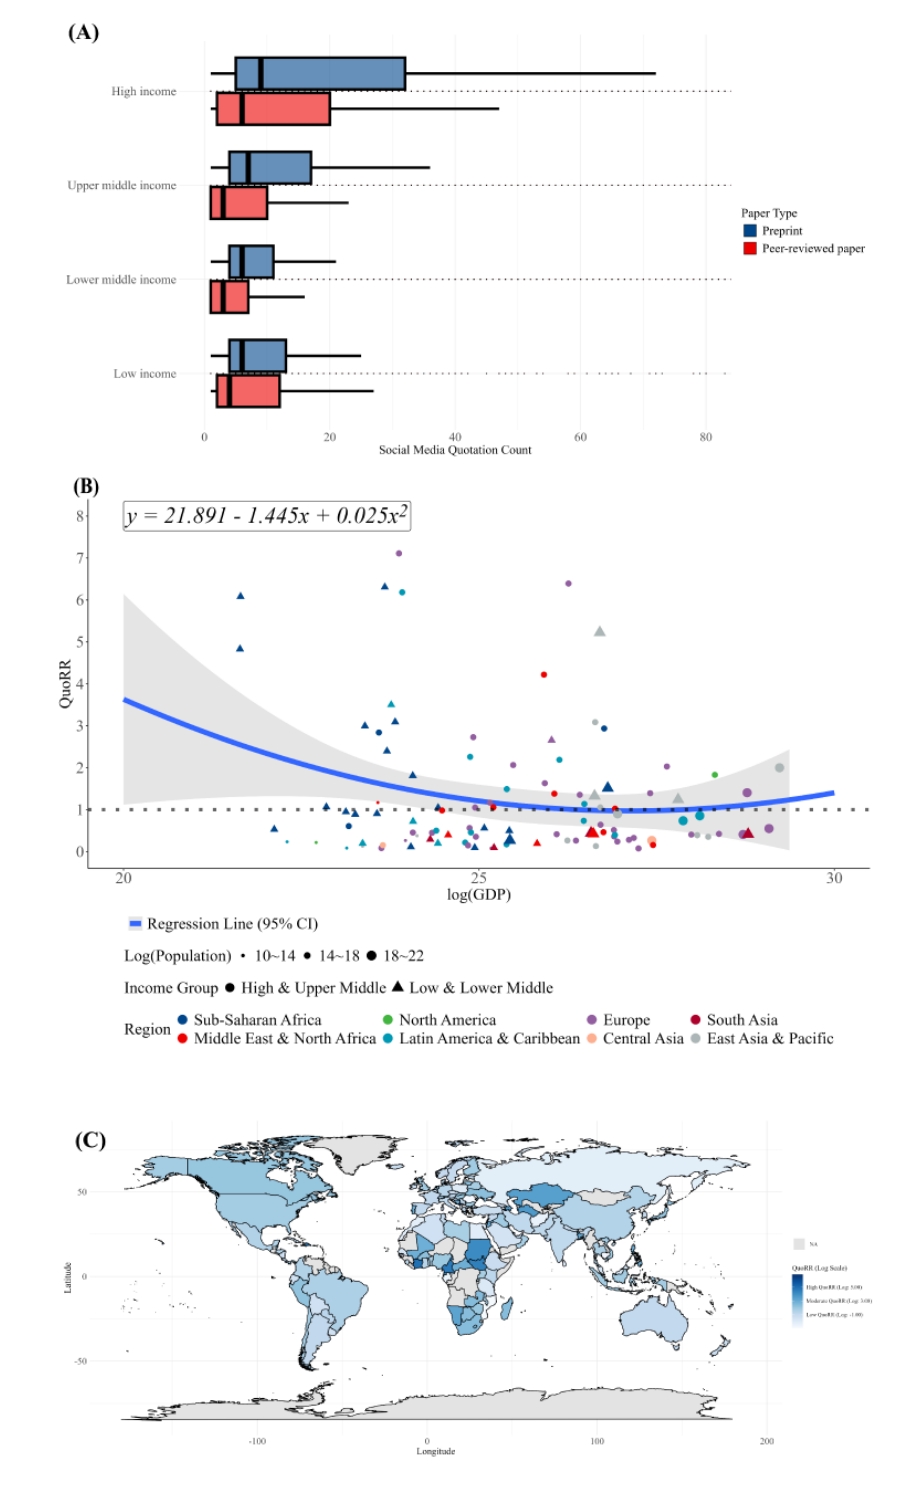
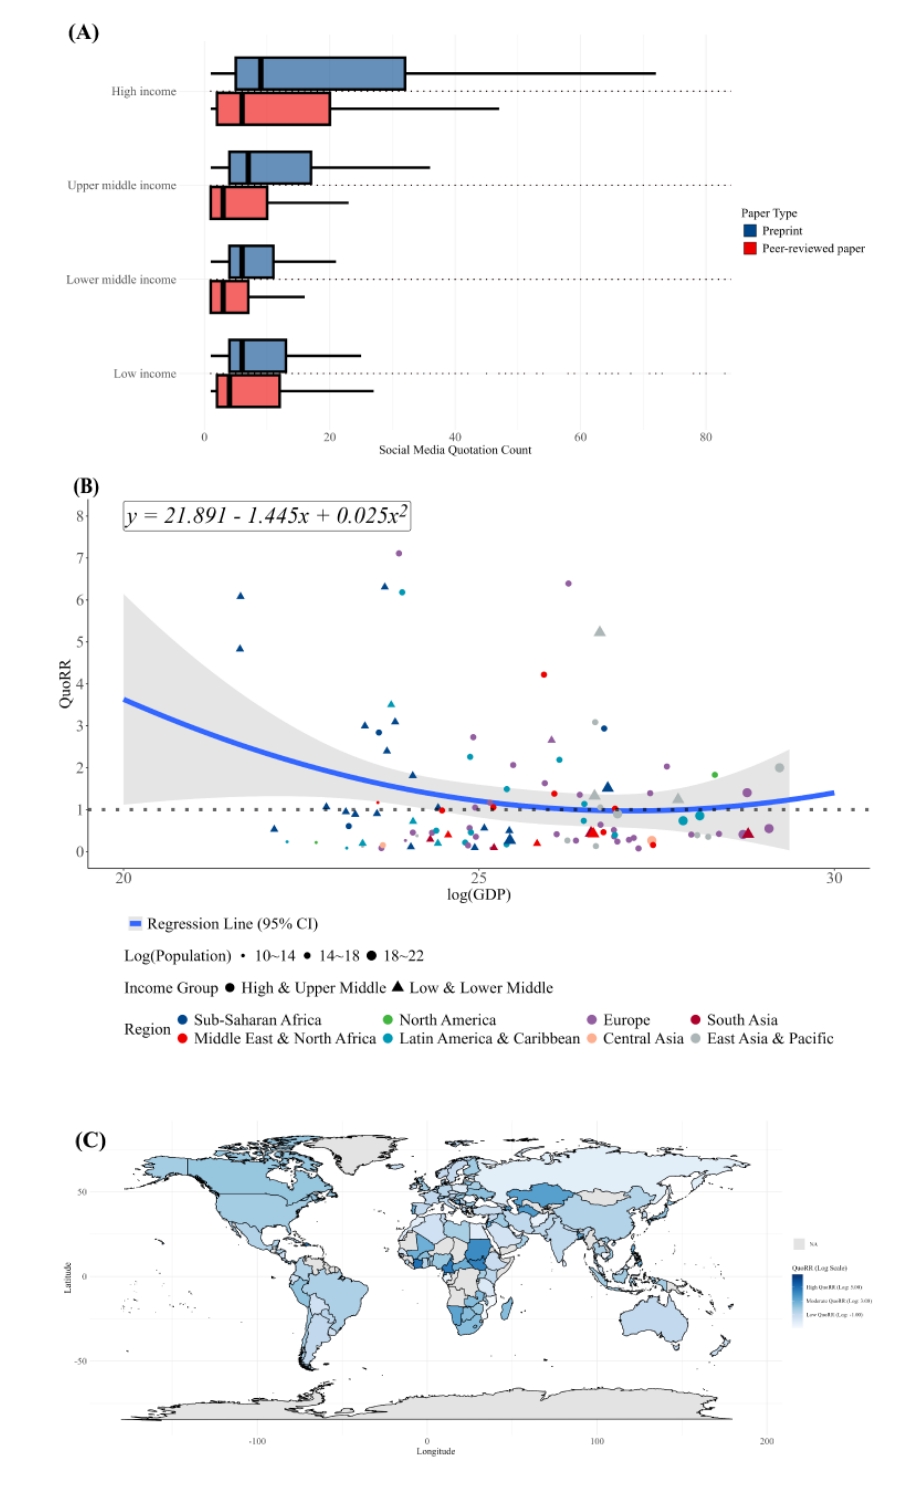
We analyzed the distribution of posts on platform X that referenced preprints and peer-reviewed papers by first authors from each country. Across all income groups, the median Social Media Quotation Count for medRxiv was significantly higher than for Scopus (Wilcoxon test, P value < 0.001) (Fig. 2A, Table S5). A significant negative correlation was found between Social Media Quotation Relative Ratio (QuoRR) and GDP (Pearson correlation coefficient: -0.17, P value = 0.046), indicating that countries with lower GDPs had a higher relative share of social media quotations for preprints (Fig. 2B). Approximately half of the countries in North America, Sub-Saharan Africa, and Middle East & North Africa had QuoRR values greater than 1, suggesting relatively higher social media attention for preprints in these regions (Fig. 2C, Fig. S5). High QuoRR values were observed in countries like Cameroon (80.8), South Sudan (62.9), Sudan (36.7), Turkmenistan (19.3), and Kazakhstan (13.1) (Table S6).
Social media readership patterns
We compared social media engagement for preprints versus peer-reviewed papers across countries. No significant correlation was found between GDP and the Social Media Readership Relative Ratio (ReadRR) (Pearson correlation coefficient: -0.11, P value = 0.136) (Fig. S6, Fig. S7). Both paper types exhibit a similar decline in the social media quotation-to-paper ratio from high- to low-income groups, with no significant difference observed (Fig. S8). The general public was the most frequent group citing both preprints and peer-reviewed papers, with a higher engagement rate for preprints (preprints: 88.26%, peer-reviewed papers: 85.75%, P value < 0.001) (Fig. S9). Scientists, practitioners and science communicators showed greater engagement with peer-reviewed articles (P value < 0.001). The Public Engagement Relative Ratio (PERR) exhibited a negative correlation with GDP (Pearson correlation coefficient: -0.20, P value = 0.021). In North America and Central Asia, all countries had PERR values greater than 1. Similarly, in East Asia & Pacific, Sub-Saharan Africa, and Latin America & Caribbean, approximately 90% of countries had PERR greater than 1 (Fig. S10). High PERR values were observed in countries like Algeria (1.2), Palestine (4.4), Cameroon (1.3), Kazakhstan (1.2), Armenia (1.2), and Cambodia (1.2) (Table S7).
Citation analyses
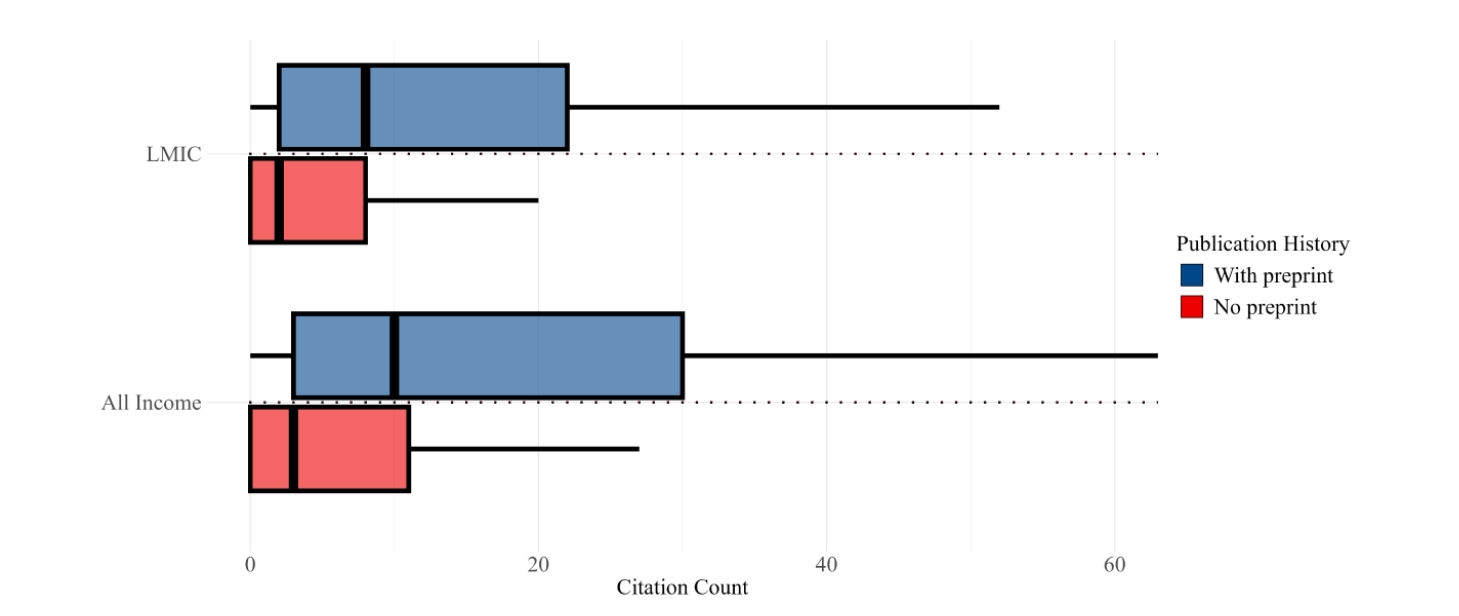
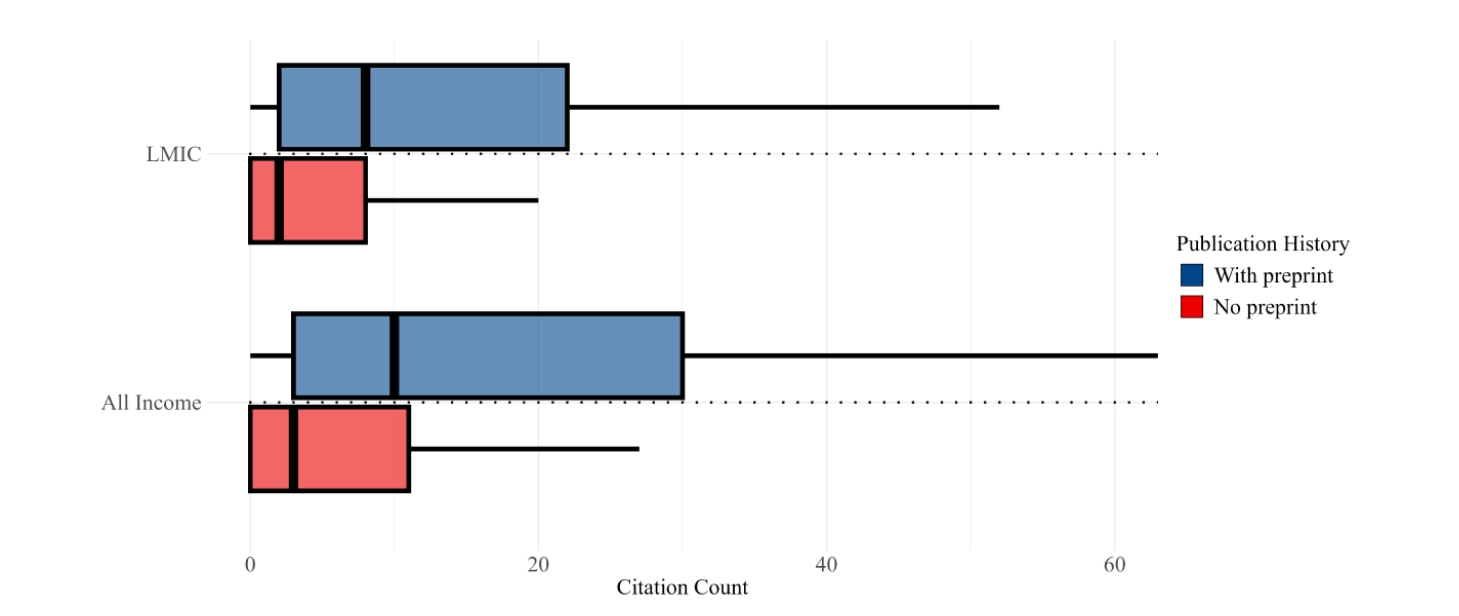
We assessed the impact of prior preprint publication on subsequent citation counts in peer-reviewed journals. Papers with a preprint history had significantly higher citation counts (median=10 [Q1–Q3: 3–30]) compared to those without (median=3 [Q1–Q3: 0–11]) (P value < 0.001) (Fig. 3). This trend held true for papers from low- and middle-income countries (LMICs), with preprints receiving higher citation counts (median=8 [Q1–Q3: 2–22]) than those without (median=2 [Q1–Q3: 0–8]) (P value < 0.001). The median citation counts by country for preprints and peer-reviewed papers are shown in Fig. S11 and citation count statistics by region and income group for peer-reviewed papers and preprints in Table S8. We also tracked changes in the income classification of first authors when preprints transitioned to peer-reviewed publications. Of these, 57% of preprints from low-income countries, 49% from lower-middle-income countries, and 22% from upper-middle-income countries were subsequently published with first authors from higher-income groups. Among LMIC preprints, 22 remained published by LMIC authors, while 26 transitioned to authorship from high-income countries (Table S9).
Discussion
This study provides a comprehensive bibliometric analysis of how preprints influenced regional diversity in scientific communication during the COVID-19 pandemic. Our comparative analysis of preprints and peer-reviewed publications revealed distinct patterns across geographical regions and economic strata. Three key findings emerged: First, preprints significantly enhanced international collaboration by facilitating the inclusion of authors from regions traditionally underrepresented in peer-reviewed publications. Second, researchers from lower-GDP countries showed higher engagement with preprint platforms, suggesting these platforms serve as a more accessible publication route. Third, preprints demonstrated broader reach through social media engagement and, notably, papers that began as preprints achieved higher citation counts after peer review, particularly those from lower-GDP regions. These findings collectively indicate that preprints serve as an effective mechanism for democratizing scientific communication, enabling researchers from underrepresented regions to increase their visibility and impact in the global scientific discourse.
Our study found that peer-reviewed publications tend to rely heavily on established collaborative networks, especially in affluent regions such as North America, Europe, and East Asia. This reliance may be attributed to long-standing research relationships [18-20], greater access to funding [21,22], and the prestige of established institutions [23-25]. In contrast, our analysis revealed that preprints demonstrated a more balanced distribution of collaborations across regions, with particularly strong representation from lower-GDP countries. The higher utilization of preprint servers by researchers from lower-GDP countries compared to traditional peer-reviewed journals suggests that preprints provide a more accessible publication route for these researchers.
This accessibility proved especially crucial during the COVID-19 pandemic [26], where rapid dissemination of research findings was essential for global public health responses [27]. By enabling researchers from lower-income regions to contribute more readily to the scientific discourse, preprints helped foster greater inclusivity in scientific communication during a critical period.
Our analysis further revealed that preprints were disseminated more extensively on social media, particularly by public users. This trend was especially pronounced among papers by researchers from lower-GDP countries, for whom social media served as a crucial tool to enhance visibility and facilitate engagement with a broader audience [28,29]. The role of social media in disseminating research is critical, as it provides an alternative avenue for researchers who may lack the traditional means of publication and collaboration [28,30]. Previous studies have shown that social media can significantly increase the citation impact of research, particularly for authors from institutions with fewer resources [31,32]. This suggests that the use of social media not only facilitates the dissemination of research but also democratizes access to scientific knowledge, allowing researchers from lower GDP countries to engage more actively in global discourse.
Our analyses also indicate that peer-reviewed papers that originated as preprints tend to receive a significantly higher median citation count compared to those that did not. This trend is especially pronounced for papers where LMIC researchers are the first authors. The increased visibility and dissemination afforded by preprints may enhance subsequent citations, as preprints often serve as a preliminary platform for sharing research findings, which can lead to greater engagement and discourse within the academic community [33-35]. However, it has been observed that LMIC authorship in preprints often shifts to higher-income countries in peer-reviewed versions, likely due to disparities in funding, institutional support, and perceived credibility [21,36]. This raises concerns about equity and representation in global research outputs [37,38].
Despite the advantages of preprints, concerns regarding their quality and credibility persist due to the absence of formal peer review prior to publication. Addressing these concerns requires fostering an open discussion environment with interactive feedback mechanisms [39]. Utilizing communication tools such as forums and collaborative platforms can enhance the quality assurance of preprints by allowing researchers to engage in constructive dialogue about the findings presented [40]. This approach is supported by the notion that preprints can be revised based on community input. Furthermore, the integration of communication tools such as social media can facilitate these discussions, allowing researchers to share insights and critiques in real-time. The use of interactive feedback mechanisms can help establish frameworks, allowing for a more robust evaluation of preprints. This aligns with the findings of Weissgerber et al., who noted that the overwhelming influx of preprints during the pandemic necessitated better monitoring and assessment strategies [41]. By leveraging communication tools, researchers can create a collaborative environment that not only addresses quality concerns but also fosters a culture of transparency and accountability in scientific communication.
Although this study provides valuable insights, there are some limitations. One limitation relates to dataset attrition bias. A total of 9.7% of peer-reviewed papers and 28.8% of preprints were excluded due to incomplete affiliation details, despite the use of advanced methods to extract country information. This higher exclusion rate for preprints is largely due to the preprint system’s reliance on free-format entries for affiliations, lacking the standardized format used in peer-reviewed papers, which complicates accurate geographic extraction. Additionally, attempts to automate web-API searches were hindered by inconsistent author identification. The reliance on SCOPUS for peer-reviewed papers and medRxiv for preprints may have excluded relevant publications from other platforms [42]. English-language queries may have missed non-English titles, particularly early COVID-19 studies from China [43]. Furthermore, the country data were based on first authors' affiliations rather than their origin, and this study did not analyze time trends or journal impact factors, which could further refine the findings. Future research could address these aspects.
Conclusions
The COVID-19 pandemic has clearly demonstrated how inequalities in scholarly communication can be exacerbated during a global health crisis. While it is unlikely that preprints will fully replace peer-reviewed journals in the medical field, they have proven to be an important tool in mitigating these inequalities. With specific and measurable objectives, collaborative efforts can contribute to the development of an inclusive and sustainable scientific communication environment.
(A) Country-specific QuoRR by descending order (top to bottom) of the country GDP (B) Bar Graph: Percentage of countries with QuoRR > 1 in each region) (C) QQ-Plots of Social Media Quotation Count by Income Group
(A) Country-specific ReadRR by descending order of the country’s GDP (B) Geographic heatmap of ReadRR (C) Bar Graph: Percentage of countries with ReadRR > 1 in each region
(A) Scatter plot of PERR (B) Geographic heatmap of PERR (C) Country-specific PERR by descending order (top to bottom) of the country’s GDP (D) Bar Graph: Percentage of countries with PERR > 1 in each region
Median of Citation Count by descending order(top to bottom) of the country’s GDP (A) Peer-reviewed Paper (B) Preprint (C) QQ-Plots of Peer-reviewed papers' citation counts
SCY reports being a chief executive officer of PHI Digital Healthcare; and grants from Daiichi Sankyo. He is a coinventor of granted Korea Patent DP-2023-1223 and DP-2023-0920, and pending Patent Applications DP-2024-0909, DP-2024-0908, DP-2022-1658, DP-2022-1478, and DP-2022-1365, unrelated to current work.
Funding
This study was supported by the NAVER Digital Bio Innovation Research Fund, funded by NAVER Corporation (Grant No. [3720230020]).
Data Availability Statement
The supplementary files, code for web-scraping medRxiv and Altmetric data, preprocessing scripts, and ratio calculation methodology are available at https://github.com/dr-you-group/SPARK_COVID.git. The repository also includes raw text data of X (formerly Twitter) preprint quotations collected for analysis. Additional details regarding data collection and analytical methods are available upon reasonable request from the corresponding author.
Ethics Approval and Consent to Participate
This study analyzed publicly available bibliometric data from SCOPUS and medRxiv, and social media data from X (formerly Twitter). No human subjects were directly involved in this research, and no personal identifiable information was collected or analyzed. Therefore, this study was exempt from institutional review board approval. The conduct and reporting of this research were guided by the principles set forth by the Strengthening the Reporting of Observational Studies in Epidemiology (STROBE) guidelines for cross-sectional studies.
We extend our sincere gratitude to Dr. Joshua Wallach from Emory University for his invaluable insights and constructive feedback that significantly enhanced this study.
Fig. 1.
Global distribution of relative preprint publication ratios by economic indicators and geographic regions
(A) Scatter plot of country GDP and Publication Relative Ratio (PubRR), (B) Geographic heatmap of PubRR values worldwide
The figure shows the relationship between countries' economic indicators and their relative preprint publication ratios. PubRR was calculated based on the count of papers published in each country according to the first author's affiliation, with top and bottom 10% outliers excluded. In panel A, the scatter plot displays log(GDP) on the x-axis and PubRR values on the y-axis, with point size representing log(Population) and colors indicating income classification (HMIC/LMIC) and geographic region. The second-order polynomial trend line shows a negative correlation (Pearson correlation coefficient -0.28, P value < 0.001). Panel B presents PubRR values on a geographic heatmap, with countries lacking PubRR data shown in gray.
GDP, Gross Domestic Product; PubRR, Publication Relative Ratio; CI, Confidence Interval; HMIC, High-Middle Income Countries; LMIC, Low-Middle Income Countries; NA, not available.
Fig. 2.
Social media engagement patterns for COVID-19 publications by country income level and geographic distribution
(A) Boxplot of Social Media Quotation Count by Income and Paper Type, (B) Scatter plot of the country's GDP and Social Media Quotation Relative Ratio (QuoRR), (C) Geographical Heatmap of QuoRR Fig. 2 (A) is a set of boxplots for each paper type (preprints and peer-reviewed papers) based on the social media quotation counts of each paper. They are sub-grouped by the income group of the 1st author's country. Outliers were excluded when drawing these boxplots. Five-number summaries for each boxplot starting from the top are (1, 5, 9, 32, 72), (1, 2, 6, 20, 47), (1, 4, 7, 17, 36), (1, 1, 3, 10, 23), (1, 4, 6, 11, 21), (1, 1, 3, 7, 16), (1, 4, 6, 13, 25) and (1, 2, 4, 12, 27). Fig. 2 (B), (C) was made by examining the social media quotation counts of papers published in each country then calculating QuoRR.
GDP, Gross Domestic Product; QuoRR, Social Media Quotation Relative Ratio; CI, Confidence Interval; Log, Common Logarithm; HMIC, High-Middle Income Countries; LMIC, Low-Middle Income Countries; NA, not available.
Fig. 3.
Boxplot of citation count by preprint publication history
The figure shows citation count distribution of peer-reviewed papers with and without preprint history. Peer-reviewed papers with preprint history exhibited higher citation counts (median=10, Q1–Q3: 3–30) compared to those without (median=3, Q1–Q3: 0–11), P value < 0.001. This pattern was also observed in LMIC countries, where papers with preprint history received more citations (median=8, Q1–Q3: 2–22) than those without (median=2, Q1–Q3: 0–11), P value < 0.001.
LMIC, Low-Middle Income Countries.
Table 1.
Regional Comparison of International Collaboration Patterns in Preprints Versus Peer-Reviewed Publications
Peer-reviewed papers (EVC)
Preprints (EVC)
Co-authorship Enhancement Index
Europe
1.000
1.000
1.00
North America
0.106
0.812
7.66
East Asia & Pacific
0.077
0.135
1.76
Latin America & Caribbean
0.026
0.103
3.90
Middle East & North Africa
0.040
0.088
2.19
Sub-Saharan Africa
0.012
0.055
4.53
South Asia
0.031
0.033
1.07
Central Asia
0.008
0.003
4.29
Eigenvector centrality (EVC) values reflect each region's influence in international collaboration networks, weighted by connections to scientifically significant regions. The Collaboration Enhancement Index (CEI) is calculated by dividing preprint EVC by peer-reviewed publication EVC, quantifying the relative increase in international collaboration intensity through preprints. Regions with the most substantial collaboration enhancement through preprints include North America (7.66), Sub-Saharan Africa (4.53), Central Asia (4.29), Latin America & the Caribbean (3.9), and the Middle East & North Africa (2.19).
1. Ioannidis JP, Salholz-Hillel M, Boyack KW, Baas J. The rapid, massive growth of COVID-19 authors in the scientific literature. R Soc Open Sci 2021; 8: 210389.
3. Majumder MS, Mandl KD. Early in the epidemic: impact of preprints on global discourse about COVID-19 transmissibility. Lancet Glob Health 2020; 8: e627-8.
12. Iyandemye J, Thomas MP. Low income countries have the highest percentages of open access publication: a systematic computational analysis of the biomedical literature. PLoS One 2019; 14: e0220229.
15. Falagas ME, Pitsouni EI, Malietzis GA, Pappas G. Comparison of PubMed, Scopus, Web of Science, and Google Scholar: strengths and weaknesses. FASEB J 2008; 22: 338-42.
19. Chinchilla-Rodriguez Z, Ferligoj A, Miguel S, Kronegger L, de Moya-Anegon F. Blockmodeling of co-authorship networks in library and information science in Argentina: a case study. Scientometrics 2012; 93: 699-717.
20. Guerrero Bote VP, Olmeda-Gomez C, De Moya-Anegon F. Quantifying the benefits of international scientific collaboration. J Am Soc Inf Sci Technol 2013; 64: 392-404.
21. Smith MJ, Weinberger C, Bruna EM, Allesina S. The scientific impact of nations: journal placement and citation performance. PLoS One 2014; 9: e109195.
22. Tubbs-Cooley HL, Martsolf DS, Pickler RH, Morrison CF, Wardlaw CE. Development of a regional nursing research partnership for academic and practice collaborations. Nurs Res Pract 2013; 2013: 473864.
23. Chinchilla-Rodriguez Z, Sugimoto CR, Lariviere V. Follow the leader: on the relationship between leadership and scholarly impact in international collaborations. PLoS One 2019; 14: e0218309.
24. Onyancha OB. Regional and international research collaboration and citation impact in selected sub-Saharan African countries in the period 2000 to 2019. Glob Knowl Mem Commun 2020; 70: 577-94.
25. Limaymanta CH, Quiroz-de-Garcia R, Rivas-Villena JA, Rojas-Arroyo A, Gregorio-Chaviano O. Relationship between collaboration and normalized scientific impact in South American public universities. Scientometrics 2022; 127: 6391-411.
26. Gianola S, Jesus TS, Bargeri S, Castellini G. Characteristics of academic publications, preprints, and registered clinical trials on the COVID-19 pandemic. PLoS One 2020; 15: e0240123.
27. Teixeira da Silva JA, Bornemann-Cimenti H, Tsigaris P. Optimizing peer review to minimize the risk of retracting COVID-19-related literature. Med Health Care Philos 2021; 24: 21-6.
28. Giustini DM, Ali SM, Fraser M, Kamel Boulos MN. Effective uses of social media in public health and medicine: a systematic review of systematic reviews. Online J Public Health Inform 2018; 10: e62121.
29. Gates A, Featherstone R, Shave K, Scott SD, Hartling L. Dissemination of evidence in paediatric emergency medicine: a quantitative descriptive evaluation of a 16-week social media promotion. BMJ Open 2018; 8: e022298.
30. Tunnecliff J, Ilic D, Morgan P, Keating J, Gaida JE, Clearihan L, et al. The acceptability among health researchers and clinicians of social media to translate research evidence to clinical practice: mixed-methods survey and interview study. J Med Internet Res 2015; 17: e119.
31. El Rassi R, Meho LI, Nahlawi A, Salameh JS, Bazarbachi A, Akl EA. Medical research productivity in the Arab countries: 2007-2016 bibliometric analysis. J Glob Health 2018; 8: 020411.
32. Dol J, Tutelman PR, Chambers CT, Barwick M, Drake EK, Parker JA, et al. Health researchers' use of social media: scoping review. J Med Internet Res 2019; 21: e13687.
35. Subramanian K, Nalli A, Senthil V, Bhat A. Pharmaceutical industry-authored preprints: scientific and social media impact. Curr Med Res Opin 2021; 37: 269-73.
37. Sofi-Mahmudi A, Stojanova J, Vounzoulaki E, Tomlinson E, Beatriz-Pizarro A, Khademioore S, et al. Geographical and gender diversity in Cochrane and non-Cochrane reviews authorship: a meta-research study. medRxiv [Preprint] 2024; Mar 25 [cited 2026 Sep 3]. Available from https://www.medrxiv.org/content/10.1101/2024.03.23.24304672v2.
38. Schneider H, Maleka N. Patterns of authorship on community health workers in low- and middle-income countries: an analysis of publications (2012-2016). BMJ Glob Health 2018; 3: e000797.
39. Blatch-Jones A, Saucedo AR, Giddins B. The use and acceptability of preprints in health and social care settings: a scoping review. PLoS One 2023; 18: e0291627.
40. Zeng L. Changes in health communication in the age of COVID-19: a study on the dissemination of preprints to the public. Front Public Health 2023; 11: 1078115.
41. Weissgerber T, Riedel N, Kilicoglu H, Labbe C, Eckmann P, Ter Riet G, et al. Automated screening of COVID-19 preprints: can we help authors to improve transparency and reproducibility? Nat Med 2021; 27: 6-7.
43. Fidahic M, Nujic D, Runjic R, Civljak M, Markotic F, Lovric Makaric Z, et al. Research methodology and characteristics of journal articles with original data, preprint articles and registered clinical trial protocols about COVID-19. BMC Med Res Methodol 2020; 20: 161.
Evaluating regional diversity in scientific communication: a comparative analysis of COVID-19 preprints and peer-reviewed publications
Fig. 1. Global distribution of relative preprint publication ratios by economic indicators and geographic regions(A) Scatter plot of country GDP and Publication Relative Ratio (PubRR), (B) Geographic heatmap of PubRR values worldwide
The figure shows the relationship between countries' economic indicators and their relative preprint publication ratios. PubRR was calculated based on the count of papers published in each country according to the first author's affiliation, with top and bottom 10% outliers excluded. In panel A, the scatter plot displays log(GDP) on the x-axis and PubRR values on the y-axis, with point size representing log(Population) and colors indicating income classification (HMIC/LMIC) and geographic region. The second-order polynomial trend line shows a negative correlation (Pearson correlation coefficient -0.28, P value < 0.001). Panel B presents PubRR values on a geographic heatmap, with countries lacking PubRR data shown in gray.GDP, Gross Domestic Product; PubRR, Publication Relative Ratio; CI, Confidence Interval; HMIC, High-Middle Income Countries; LMIC, Low-Middle Income Countries; NA, not available.
Fig. 2. Social media engagement patterns for COVID-19 publications by country income level and geographic distribution(A) Boxplot of Social Media Quotation Count by Income and Paper Type, (B) Scatter plot of the country's GDP and Social Media Quotation Relative Ratio (QuoRR), (C) Geographical Heatmap of QuoRR Fig. 2 (A) is a set of boxplots for each paper type (preprints and peer-reviewed papers) based on the social media quotation counts of each paper. They are sub-grouped by the income group of the 1st author's country. Outliers were excluded when drawing these boxplots. Five-number summaries for each boxplot starting from the top are (1, 5, 9, 32, 72), (1, 2, 6, 20, 47), (1, 4, 7, 17, 36), (1, 1, 3, 10, 23), (1, 4, 6, 11, 21), (1, 1, 3, 7, 16), (1, 4, 6, 13, 25) and (1, 2, 4, 12, 27). Fig. 2 (B), (C) was made by examining the social media quotation counts of papers published in each country then calculating QuoRR.GDP, Gross Domestic Product; QuoRR, Social Media Quotation Relative Ratio; CI, Confidence Interval; Log, Common Logarithm; HMIC, High-Middle Income Countries; LMIC, Low-Middle Income Countries; NA, not available.
Fig. 3. Boxplot of citation count by preprint publication historyThe figure shows citation count distribution of peer-reviewed papers with and without preprint history. Peer-reviewed papers with preprint history exhibited higher citation counts (median=10, Q1–Q3: 3–30) compared to those without (median=3, Q1–Q3: 0–11), P value < 0.001. This pattern was also observed in LMIC countries, where papers with preprint history received more citations (median=8, Q1–Q3: 2–22) than those without (median=2, Q1–Q3: 0–11), P value < 0.001.LMIC, Low-Middle Income Countries.
Fig. 1.
Fig. 2.
Fig. 3.
Evaluating regional diversity in scientific communication: a comparative analysis of COVID-19 preprints and peer-reviewed publications
Peer-reviewed papers (EVC)
Preprints (EVC)
Co-authorship Enhancement Index
Europe
1.000
1.000
1.00
North America
0.106
0.812
7.66
East Asia & Pacific
0.077
0.135
1.76
Latin America & Caribbean
0.026
0.103
3.90
Middle East & North Africa
0.040
0.088
2.19
Sub-Saharan Africa
0.012
0.055
4.53
South Asia
0.031
0.033
1.07
Central Asia
0.008
0.003
4.29
Table 1. Regional Comparison of International Collaboration Patterns in Preprints Versus Peer-Reviewed Publications
Eigenvector centrality (EVC) values reflect each region's influence in international collaboration networks, weighted by connections to scientifically significant regions. The Collaboration Enhancement Index (CEI) is calculated by dividing preprint EVC by peer-reviewed publication EVC, quantifying the relative increase in international collaboration intensity through preprints. Regions with the most substantial collaboration enhancement through preprints include North America (7.66), Sub-Saharan Africa (4.53), Central Asia (4.29), Latin America & the Caribbean (3.9), and the Middle East & North Africa (2.19).