Division of Endocrinology and Metabolism, Department of Internal Medicine, Konkuk University Medical Center, Konkuk University School of Medicine, Seoul, Korea
This is an Open Access article distributed under the terms of the Creative Commons Attribution Non-Commercial License (http://creativecommons.org/licenses/by-nc/4.0/) which permits unrestricted non-commercial use, distribution, and reproduction in any medium, provided the original work is properly cited.
Big data–driven non-randomized studies (NRS) are an increasingly important source of observational evidence in evidence-based medicine, particularly when randomized controlled trials are limited, infeasible, or insufficiently generalizable to routine clinical practice. In Korea, this shift is especially pronounced because a single-payer national health insurance system enables near-complete population coverage, longitudinal follow-up, and linkage of healthcare utilization, prescriptions, and mortality data. These structural advantages, however, also create distinctive interpretative challenges. In big data–based NRS, key design elements—such as population definition, exposure classification, index dates, follow-up windows, and outcome specification—are inherently flexible. This flexibility, while analytically advantageous, increases vulnerability to residual confounding and overinterpretation. Advanced analytic approaches may improve internal validity, but they cannot fully resolve ambiguities related to population specification, temporal structure, or unmeasured contextual factors. This review discusses how to interpret big data–driven NRS using the Korean healthcare system as a representative example. We summarize the strengths that make large-scale observational research indispensable, delineate structural, institutional, and temporal factors that complicate causal inference, and propose practical principles for responsible interpretation. We emphasize the complementary responsibilities of researchers, reviewers and editors, and guideline developers in supporting transparent design, clinically plausible interpretation, and calibrated use of observational evidence in recommendations. A context-aware and proportionate approach is essential to ensure that expanding observational evidence strengthens—rather than distorts—evidence-based clinical and policy decision-making in rapidly evolving healthcare systems with complex institutional incentives.
Evidence-based medicine (EBM) has traditionally placed randomized controlled trials (RCTs) at the center of evidence generation, owing to their strong internal validity and ability to minimize bias [1,2]. However, in contemporary clinical practice, many important questions cannot be adequately addressed by RCTs alone. Ethical constraints, feasibility limitations, long follow-up requirements, rapidly evolving standards of care, and the growing need to evaluate real-world effectiveness have increasingly highlighted the limitations of an RCT-only paradigm [3,4].
In this context, large-scale, big data–driven non-randomized studies (NRS)—including cohort studies, registry-based analyses, and administrative claims data research—have assumed an expanding role in informing clinical decision-making, guideline development, and health policy [5-7]. Advances in data availability and statistical methodology have accelerated this trend, enabling observational analyses at a scale and longitudinal depth that were previously impractical [8]. As a result, observational evidence derived from big data–based NRS now constitutes a substantial component of the evidence base in many areas of medicine.
Korea represents a particularly distinctive environment for big data–driven observational research. A single-payer national health insurance system enables near-complete population coverage, longitudinal follow-up, and linkage across healthcare utilization, prescription, and mortality data [9,10]. These features have facilitated an extraordinary volume of large-scale NRS across a wide range of clinical and public health domains, extending beyond pharmacotherapy to disease epidemiology, risk stratification, screening strategies, and policy evaluation [9,11,12]. Consequently, big data–derived observational evidence plays a prominent role in clinical interpretation, guideline formulation, and health policy decisions in Korea.
However, the very conditions that make Korea an attractive setting for big data–based NRS also introduce substantial interpretative challenges. The flexibility inherent in observational study design, combined with complex reimbursement rules, policy-driven healthcare utilization patterns, rapid demographic transitions, and fast-paced changes in clinical practice, creates fertile ground for residual confounding and overinterpretation [13-16]. Although sophisticated statistical techniques can improve internal validity, they cannot fully compensate for ambiguities in population definition, exposure classification, time structure, or unmeasured contextual factors inherent to administrative data [17,18]. When these limitations are insufficiently acknowledged, findings from large-scale observational studies may be implicitly treated as causal evidence, leading to exaggerated conclusions or inappropriate translation into guidelines and policy.
Therefore, the central challenge is not whether NRS should be used, but how big data–driven observational evidence should be interpreted. Particularly in settings such as Korea, where such evidence is abundant and influential, a balanced framework is required—one that recognizes the strengths of large-scale NRS while applying rigorous scrutiny to their limitations. This review provides a context-specific framework for interpreting big data–driven observational evidence in modern EBM, with a focus on the Korean healthcare system. We discuss the methodological strengths that have made these studies indispensable, the structural and contextual factors that complicate their interpretation, and practical principles for researchers, reviewers/editors, and guideline developers to avoid overestimation and misuse of observational evidence.
What Are Non-Randomized Studies in Evidence-Based Medicine?
NRS are investigations in which exposures or interventions are not assigned through randomization, but instead arise from routine clinical practice, patient characteristics, or healthcare system factors [7]. Unlike RCTs, which are defined by experimental allocation, NRS are defined by their observational nature, regardless of whether the underlying data originate from cohort studies, case–control designs, registries, administrative claims, or electronic health records [5,19].
The defining methodological feature of NRS is that comparability between study groups is not ensured by design, but must be approximated analytically [20]. Whereas randomization in RCTs aims to balance both measured and unmeasured confounders, NRS must explicitly confront the possibility of systematic differences between exposed and unexposed groups [21]. As a result, NRS are inherently vulnerable to confounding, selection bias, and time-related biases, and their validity depends critically on how these issues are anticipated, addressed, and transparently reported [18,22].
Within EBM, NRS should therefore be understood not as failed attempts at experimentation, but as a fundamentally different class of evidence. Their interpretation requires a shift in emphasis—from whether bias exists to whether potential biases are sufficiently explicit, plausible, and consistent with the observed findings. As the scale and influence of observational research have expanded through the increasing use of large administrative and registry-based datasets, these interpretative challenges have become more consequential. In healthcare systems where big data–driven NRS play a central role in informing clinical and policy decisions, careful attention to context and design assumptions is particularly essential.
Why Large-Scale Observational Studies Matter: Questions Beyond the Reach of RCTs
While RCTs remain central to evidence-based medicine, their design is optimized for a specific subset of clinical questions, typically focusing on short- to medium-term efficacy under controlled conditions. Many clinically and policy-relevant questions fall outside this scope. In such contexts, large-scale, big data–driven observational studies, rather than NRS in general, often represent the primary or only feasible source of evidence.
Big data–based observational research is particularly valuable when long-term outcomes are of interest. Extended follow-up, delayed adverse effects, and infrequent outcomes are difficult to capture within the constraints of randomized trials. In contrast, longitudinal administrative and registry data allow sustained observation over years or decades, making them indispensable for evaluating long-term safety, prognosis, and patterns of care. These strengths are most evident in healthcare systems with comprehensive population coverage, where loss to follow-up is minimized and outcome ascertainment is relatively complete [13,23].
Another critical role of large-scale observational evidence lies in evaluating care delivered to populations that are poorly represented in RCTs. Older adults, patients with multiple comorbidities, and individuals receiving complex or evolving treatment regimens often differ substantially from trial populations [24]. In such settings, big data–driven observational evidence does not merely complement randomized trials but increasingly shapes clinical interpretation and policy discourse. Moreover, many real-world clinical questions concern patterns and strategies of care rather than isolated interventions. Treatment sequencing, switching, discontinuation, adherence, and comparative effectiveness among commonly used options are rarely addressed through randomization, yet they are central to everyday clinical decision-making [25,26].
Finally, large-scale observational studies play a pivotal role in informing health policy and system-level decisions. Evaluations of screening programs, reimbursement policies, and healthcare delivery models typically rely on observational evidence, as randomized experimentation at the population level is often infeasible [27,28]. In these contexts, big data–driven observational evidence does not merely complement randomized trials but shapes policy discourse directly—underscoring the need for careful interpretation of its strengths and limitations.
The Korean Context: Why Big Data–Driven Observational Evidence Has Become Exceptionally Influential
Korea represents a distinctive environment in which big data–driven observational evidence plays an unusually prominent role within EBM. This is largely attributable to the structure of its healthcare system, which enables near-complete population coverage through a single-payer national health insurance framework. As a result, healthcare utilization, prescription records, diagnostic codes, and mortality data can be longitudinally captured and linked for the vast majority of the population.
Such comprehensive data infrastructure provides several methodological advantages for large-scale observational research. Large sample sizes allow the study of relatively uncommon diseases, subpopulations, and outcomes that would be difficult to examine in smaller or fragmented healthcare systems [29]. Longitudinal follow-up facilitates the evaluation of disease trajectories, treatment patterns, and long-term outcomes across extended periods [8,12]. In addition, population-level data reduce selection bias related to healthcare access, enhancing the relevance of findings to routine clinical practice [12,24]. These features have enabled the rapid expansion of big data–based NRS across diverse clinical and public health domains.
Importantly, the influence of Korean observational evidence extends beyond research volume. Findings from large-scale administrative and registry-based studies are frequently cited in clinical reviews, inform guideline discussions, and shape health policy decisions [5,26,30]. In areas where randomized evidence is limited or slow to emerge, big data–driven observational studies often function as de facto reference points for clinical interpretation [26]. While this prominence reflects the strengths of the Korean data environment, it also magnifies the consequences of misinterpretation. As observational evidence becomes increasingly visible and influential, careful attention to its contextual foundations becomes essential—a theme that underlies the challenges discussed in the following sections.
The Other Side of the Coin: Structural Pitfalls of Extensive Big Data–Driven Observational Research in Korea
The same structural conditions that have strengthened the role of big data–driven observational evidence in Korea also introduce important vulnerabilities. As large-scale NRS become increasingly abundant, influential, and methodologically sophisticated, the primary risk shifts from a lack of evidence to the uncritical acceptance of results that appear robust while resting on fragile assumptions. In this setting, the challenge is not the existence of bias per se, but the growing distance between analytical complexity and interpretative caution.
One major source of vulnerability arises from the high degree of flexibility inherent in large-scale observational study design and analysis. Population definitions, exposure classifications, index dates, follow-up windows, and outcome specifications can often be modified in multiple plausible ways using the same underlying datasets. While such flexibility enables tailored analyses, it also increases the likelihood that analytically favorable results may emerge without sufficient consideration of alternative specifications that could lead to different conclusions [31,32].
Advanced statistical techniques further contribute to this tension. Methods such as multivariable adjustment, propensity score–based approaches, and time-dependent modeling can meaningfully reduce bias when appropriately applied [18]. However, in big data–driven NRS, methodological sophistication may inadvertently convey a false sense of causal certainty, particularly when statistical refinement is emphasized more than clinical plausibility or contextual coherence [8,33]. Statistical adjustment cannot compensate for ambiguities in population selection, exposure timing, or outcome ascertainment, nor can it fully address confounding by factors that are poorly measured or absent in administrative data [8,18].
Another important concern is the progressive blurring of association and causation in the interpretation of findings from large observational datasets [34]. Large sample sizes and narrow confidence intervals can yield statistically compelling results even when residual confounding remains substantial [35,36]. When similar associations are repeatedly reported across multiple studies using overlapping data sources, they may be perceived as confirmatory evidence despite sharing the same structural limitations [32]. In Korea, where the volume and visibility of big data–based NRS are particularly high, this accumulation effect amplifies the risk of interpretative drift—where observational associations are implicitly treated as causal effects.
Distortion of Healthcare Utilization by Reimbursement Rules and Health Policy
In Korea, patterns of healthcare utilization observed in big data–driven NRS are strongly shaped by reimbursement rules that define what care is eligible for coverage. Because access to treatments, diagnostic tests, and procedures is closely tied to insurance criteria, the care captured in administrative datasets often reflects institutional constraints rather than purely clinical decision-making [11,37]. As a result, exposures identified in observational analyses may represent reimbursable care pathways rather than the full spectrum of clinically considered options.
Reimbursement criteria can directly influence exposure definition in observational studies. Treatments that may be clinically appropriate are often initiated only after specific coverage requirements are met, while diagnostic codes or laboratory findings may be preferentially recorded to justify reimbursement [11]. Stepwise reimbursement structures can further delay treatment initiation or channel patients into predefined therapeutic sequences. In such settings, exposure timing and treatment selection are partially determined by institutional design, complicating causal interpretation in big data–based NRS [38].
These reimbursement-driven patterns also shape the intensity of healthcare utilization. Patients who meet coverage criteria typically undergo more frequent follow-up visits, laboratory testing, and monitoring. Such differences in utilization are closely linked to factors such as healthcare access, socioeconomic status, and health-seeking behavior—variables that are incompletely captured in administrative data [18,36]. Consequently, healthcare utilization itself may act as an unmeasured confounder, generating apparent associations that are not directly attributable to the exposure of interest.
Beyond reimbursement rules, national health policies introduce an additional layer of complexity in the interpretation of observational evidence. Policy changes—such as revisions to coverage thresholds, approval of new therapies, modifications in copayment structures, or expansion of national screening programs—can lead to abrupt shifts in diagnosis rates, treatment uptake, and observed outcomes [27,39]. When such transitions are not explicitly modeled, policy-driven effects may be misattributed to treatment effects in observational analyses.
Taken together, reimbursement rules establish the baseline structure of observable care, while health policies dynamically reshape that structure over time. Failure to distinguish between these institutional mechanisms risks conflating system-level design, rapid shifts in the treatment landscape, and biological or therapeutic causality. In the context of Korea’s government-driven single-payer system and its extensive use of claims-based big data, explicit consideration of reimbursement structures, nationally standardized policy incentives, and utilization-driven data capture is therefore essential for responsible interpretation of NRS findings (Table 1).
Rapid Demographic and Societal Change as a Source of Time-Dependent Confounding
Another defining feature of big data–driven NRS conducted in Korea is the exceptionally rapid pace of demographic, societal, and healthcare system change [40]. Within relatively short time frames, population structure, disease burden, diagnostic practices, and standards of care have evolved substantially. In such an environment, long-term observational analyses are exposed to layers of time-dependent confounding that are more complex and more densely intertwined than in many other settings [41].
Korea has experienced one of the fastest rates of population aging worldwide, accompanied by a rapid increase in multimorbidity and polypharmacy [42,43]. Consequently, individuals observed at different calendar periods within the same long-term dataset may differ fundamentally in baseline risk profiles, functional status, and life expectancy—even when classified under identical disease codes [17]. These qualitative shifts are only partially captured by variables available in administrative data, leaving substantial residual confounding that cannot be fully addressed through statistical adjustment [18,36].
At the same time, clinical practice has undergone accelerated transformation, driven in part by rapid shifts in the treatment landscape following the introduction of new therapies and evolving clinical guidelines. Diagnostic criteria have been revised, screening programs expanded, and therapeutic options diversified within short intervals. Apparent changes in disease incidence, treatment patterns, or outcomes may therefore reflect altered detection thresholds or evolving clinical definitions rather than true changes in underlying risk [44]. When calendar time is treated merely as an adjustment variable, these structural shifts are easily obscured. This issue is particularly salient in long-term time-series and before–after analyses based on national claims data [45,46]. In Korea, multiple institutional and clinical transitions—including guideline revisions, reimbursement policy changes, and public health initiatives—often occur within the same analytic window [37,38]. As a result, calendar time functions not as a neutral dimension but as a composite proxy for numerous unmeasured and interacting structural factors [17]. Without explicit recognition of Korea’s compressed demographic transition, rapid evolution of clinical practice, and overlapping institutional shifts, temporal trends embedded within calendar time may be misinterpreted as treatment effects or causal associations.
Rapid demographic and societal change further complicates cross-national comparisons. Even when similar study designs and follow-up durations are employed, the density of transitions embedded within a given time frame may differ markedly across countries. A ten-year observational period in Korea may encompass far more demographic, clinical, and institutional transformation than an equivalent period in settings with slower socioeconomic and policy evolution. Failure to account for this asymmetry risks misleading conclusions when interpreting or extrapolating findings from Korean big data–driven NRS (Table 2).
Practical Principles for Interpreting Big Data–Driven NRS in Rapidly Evolving Healthcare Systems
Implications for researchers
For researchers conducting big data–driven NRS in Korea, the primary responsibility lies in making the institutional and clinical context of the study explicit. This begins with transparent definition of the study population, including how eligibility and inclusion are shaped by reimbursement rules, healthcare access, and prior utilization patterns. Simply reporting inclusion criteria is insufficient; investigators should clarify why the observed population emerges within the healthcare system and how it may differ from the broader clinical population of interest. Exposure definition requires particular care in claims-based analyses. Treatments and interventions recorded in administrative data often reflect what is reimbursable rather than what is clinically preferred. Researchers should explicitly acknowledge institutional constraints that may influence treatment initiation, sequencing, or discontinuation. When stepwise reimbursement structures or policy thresholds affect exposure timing, analytic strategies should be selected accordingly, and their interpretative implications clearly discussed. Finally, restraint in causal language is essential. Even when advanced statistical techniques yield precise estimates, conclusions should reflect the inherent uncertainty of observational evidence and clearly distinguish association from causation.
Implications for reviewers and editors
Reviewers and editors play a critical gatekeeping role in preventing interpretative drift as big data–based NRS become increasingly prominent. Evaluation should extend beyond statistical methodology to include scrutiny of clinical plausibility and institutional context. Reviewers should assess whether population definitions, exposure timing, and comparison groups are meaningful within the reimbursement and policy environment in which the data were generated. Particular attention should be paid to whether observed associations could plausibly reflect policy changes, reimbursement criteria, or time-related structural shifts rather than true treatment effects. Methodological sophistication should not be equated with causal validity. Editors, in turn, should encourage proportional conclusions: large sample size and narrow confidence intervals should not justify strong causal claims in the absence of robust design features. Explicit discussion of contextual limitations should be viewed as a marker of rigor rather than weakness.
Implications for guideline developers and policymakers
For guideline developers and policymakers, big data–driven NRS often represent an indispensable source of evidence, particularly when randomized data are unavailable or insufficiently generalizable. However, incorporation of observational findings into recommendations requires careful calibration of evidentiary weight [47,48]. Panels should consider whether reported effects reflect clinical mechanisms or institutional artifacts arising from reimbursement rules, policy incentives, or healthcare utilization patterns [11,26]. Evidence derived from a single national healthcare system should also be evaluated with attention to transferability, especially when recommendations are intended for broader application [5,24]. Rather than seeking definitive causal answers, guideline developers should use observational evidence to inform direction, plausibility, and hypothesis generation, while maintaining flexibility in recommendation strength [26,49]. Transparent articulation of uncertainty and contextual dependence is essential to avoid overconfidence in conclusions drawn from big data–based NRS [33,50].
Concluding Remarks
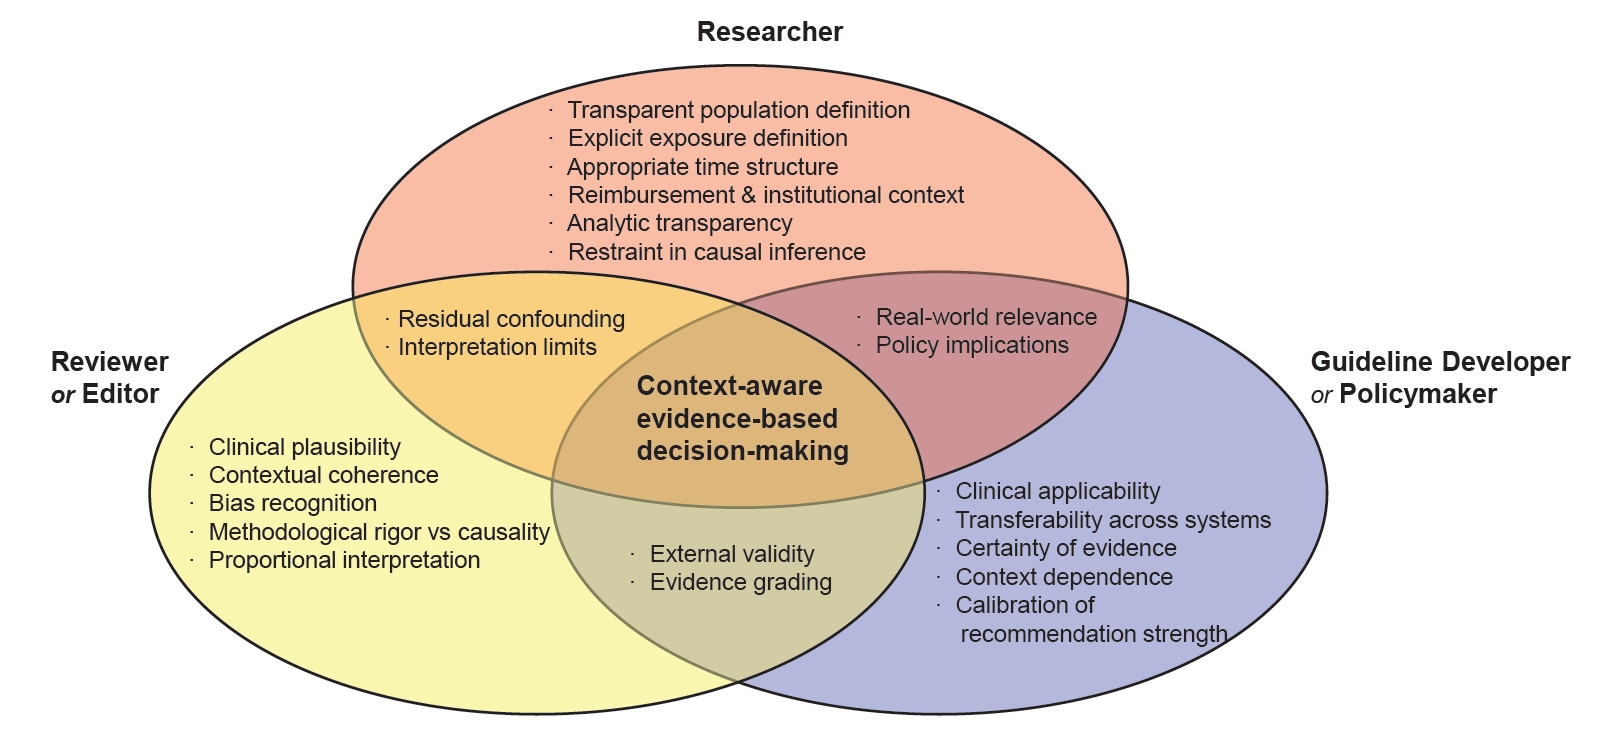
Big data–driven NRS have become an increasingly influential component of evidence-based medicine, particularly in healthcare systems where randomized evidence is limited or insufficiently generalizable. In Korea, comprehensive population coverage and longitudinal administrative data have enabled large-scale observational analyses that inform clinical practice, guidelines, and policy, while simultaneously introducing distinctive interpretative challenges. Reimbursement structures, policy-driven healthcare utilization, rapid demographic aging, and compressed transitions in clinical practice collectively shape observed associations, which may reflect institutional and temporal dynamics as much as true clinical effects. Although advanced analytic methods can reduce certain biases, they cannot fully resolve ambiguities related to population definition, exposure timing, or unmeasured context. As illustrated in Fig. 1, responsible interpretation of big data–driven NRS requires shared accountability among researchers, reviewers and editors, and guideline developers, grounded in contextual awareness and proportional inference. When approached with such rigor and restraint, observational evidence can strengthen—rather than distort—evidence-based clinical and policy decision-making in rapidly evolving healthcare systems.
Notes
Conflict of Interest
The author declares no competing financial or non-financial interests related to this work.
Funding
This research received no external funding.
Data Availability Statement
All data generated or analyzed during this study are included in this published article.
Ethics Approval and Consent to Participate
Not applicable.
Authors Contributions
Jong Han Choi conceived the study concept and design, performed the literature review, synthesized the evidence, and drafted the manuscript. The author critically reviewed the manuscript for important intellectual content and approved the final version for publication.
Acknowledgments
The author thanks colleagues for constructive discussions and feedback during manuscript development. The author also acknowledges ChatGPT for assistance with English language refinement and clarity of expression. The author takes full responsibility for the content and interpretation presented in this manuscript.
Fig. 1.
Shared and Role-Specific Responsibilities in Interpreting Big Data–Driven Non-Randomized Studies.
This figure illustrates the complementary and overlapping responsibilities of researchers, reviewers/editors, and guideline developers in interpreting big data–driven non-randomized studies within rapidly evolving healthcare systems. Researchers are responsible for transparent study design and explicit acknowledgment of institutional constraints; reviewers and editors for evaluating contextual and clinical plausibility beyond statistical rigor; and guideline developers for calibrating evidentiary weight and transferability. The overlapping domains highlight shared accountability for recognizing residual confounding, contextual dependence, and limitations of causal inference. Responsible interpretation of observational evidence emerges at the intersection of these roles.
Table 1.
Institutional Characteristics of Korea’s Government-Driven Single-Payer System That Shape Observed Healthcare Utilization in Big Data–Driven Observational Studies
Domain
Key institutional feature
How distortion arises in claims-based big data
Implications for Interpretation
Coverage eligibility and reimbursement rules
Nationally standardized coverage criteria determined by a single public payer
Treatments are initiated only after predefined reimbursement thresholds are met; diagnostic codes and tests may be preferentially recorded to justify coverage
Observed exposures reflect reimbursable care pathways rather than the full range of clinically considered options
Stepwise reimbursement and access control
Sequential approval and escalation requirements enforced at the national level
Delayed treatment initiation and forced stepwise treatment pathways
Exposure timing and sequencing are partially institution-driven rather than clinician-driven
Uniform provider incentives
Homogeneous reimbursement incentives across providers nationwide
Limited variation in practice patterns unrelated to patient characteristics
Reduced heterogeneity may mask clinically meaningful differences
Utilization-driven data capture
Claims data generated primarily for reimbursement purposes
Healthcare utilization intensity influences the probability of diagnosis and outcome detection
Utilization itself may function as an unmeasured confounder
Table 2.
Korea-Specific Sources of Time-Dependent Confounding in Long-Term Big Data–Driven Observational Studies
Category
Korea-specific temporal change
How time-dependent confounding arises
Implications for interpretation
Compressed demographic transition
Rapid population aging within a short historical period
Patient populations with the same diagnosis differ substantially across calendar time
Comparability across time periods is compromised even within identical disease categories
Accelerated epidemiologic and societal change
Rapid shifts in disease burden, lifestyle, and socioeconomic structure
Background risk profiles change faster than analytic models can fully capture
3. Kim HS, Lee S, Kim JH. Real-world evidence versus randomized controlled trial: clinical research based on electronic medical records. J Korean Med Sci 2018; 33: e213.
4. Azoulay L. Rationale, strengths, and limitations of real-world evidence in oncology: a Canadian review and perspective. Oncologist 2022; 27: e731-e738.
6. Franklin JM, Schneeweiss S, et al. Evaluating the use of nonrandomized real-world data analyses for regulatory decision making. Clin Pharmacol Ther 2019; 105: 867-77.
7. Concato J, Shah N, Horwitz RI. Randomized, controlled trials, observational studies, and the hierarchy of research designs. N Engl J Med 2000; 342: 1887-92.
9. Cheol Seong S, Kim YY, Khang YH, et al. Data resource profile: the National Health Information Database of the National Health Insurance Service in South Korea. Int J Epidemiol 2017; 46: 799-800.
10. Lee J, Lee JS, Park SH, et al. Cohort profile: the National Health Insurance Service-National Sample Cohort (NHIS-NSC), South Korea. Int J Epidemiol 2017; 46: e15.
11. Kim JA, Yoon S, Kim LY, et al. Towards Actualizing the Value Potential of Korea Health Insurance Review and Assessment (HIRA) Data as a Resource for Health Research: Strengths, Limitations, Applications, and Strategies for Optimal Use of HIRA Data. J Korean Med Sci 2017; 32: 718-28.
12. Kim MK, Han K, Lee SH. Current trends of big data research using the Korean National Health Information Database. Diabetes Metab J 2022; 46: 552-63.
15. Powell M, Clark C, Alyakin A, Vogelstein JT, Hart B. Exploration of residual confounding in analyses of associations of metformin use and outcomes in adults with type 2 diabetes. JAMA Netw Open 2022; 5: e2241505.
17. Hernan MA, Sauer BC, Hernandez-Diaz S, et al. Specifying a target trial prevents immortal time bias and other self-inflicted injuries in observational analyses. J Clin Epidemiol 2016; 79: 70-5.
18. Brookhart MA, Stürmer T, Glynn RJ, Rassen J, Schneeweiss S. Confounding control in healthcare database research: challenges and potential approaches. Med Care 2010; 48: S114-20.
19. von Elm E, Altman DG, Egger M, et al. The Strengthening the Reporting of Observational Studies in Epidemiology (STROBE) statement: guidelines for reporting observational studies. PLoS Med 2007; 4: e296.
21. Bosdriesz JR, Stel VS, van Diepen M, Meuleman Y, Dekker FW, et al. Evidence-based medicine-When observational studies are better than randomized controlled trials. Nephrology (Carlton) 2020; 25: 737-43.
23. Liu F, Panagiotakos D. Panagiotakos, Real-world data: a brief review of the methods, applications, challenges and opportunities. BMC Med Res Methodol 2022; 22: 287.
25. Brookhart MA, Patrick AR, Dormuth C, et al. Adherence to lipid-lowering therapy and the use of preventive health services: an investigation of the healthy user effect. Am J Epidemiol 2007; 166: 348-54.
26. Franklin JM, Schneeweiss S. When and How Can Real World Data Analyses Substitute for Randomized Controlled Trials? Clin Pharmacol Ther 2017; 102: 924-33.
27. Craig P, Cooper C, Gunnell D, et al. Using natural experiments to evaluate population health interventions: new Medical Research Council guidance. J Epidemiol Community Health 2012; 66: 1182-6.
29. Benchimol EI, Smeeth L, Guttmann A, et al. REporting of studies Conducted using Observational Routinely-collected health Data (RECORD) statement. PLoS Med 2015; 12: e1001885.
30. Kwon CY, Park IS. National Health Insurance Data as a Research Tool in Korean Medicine: a guide to database utilization and methodological approaches. J Pharmacopuncture 2025; 28: 1-10.
31. Patel CJ, Burford B, Ioannidis JPA. Assessment of vibration of effects due to model specification can demonstrate the instability of observational associations. J Clin Epidemiol 2015; 68: 1046-58.
37. Song SO, Jung CH, Song YD, et al. Background and data configuration process of a nationwide population-based study using the korean national health insurance system. Diabetes Metab J 2014; 38: 395-403.
38. Kim JY, Kim SJ, Nam CM, Moon KT, Park EC. Changes in prescription pattern, pharmaceutical expenditure and quality of care after introduction of reimbursement restriction in diabetes in Korea. Eur J Public Health 2018; 28: 209-14.
40. GBD 2019 Diseases and Injuries Collaborators. Injuries, Global burden of 369 diseases and injuries in 204 countries and territories, 1990-2019: a systematic analysis for the Global Burden of Disease Study 2019. Lancet 2020; 396: 1204-22.
42. Kim J, Keshavjee S, Atun R. Trends, patterns and health consequences of multimorbidity among South Korea adults: Analysis of nationally representative survey data 2007-2016. J Glob Health 2020; 10: 020426.
45. Wagner AK, Soumerai SB, Zhang F, et al. Segmented regression analysis of interrupted time series studies in medication use research. J Clin Pharm Ther 2002; 27: 299-309.
46. Bernal JL, Cummins S, and A. Gasparrini, Interrupted time series regression for the evaluation of public health interventions: a tutorial. Int J Epidemiol 2017; 46: 348-55.
47. Guyatt GH, Oxman AD, Vist GE, et al. GRADE: an emerging consensus on rating quality of evidence and strength of recommendations. BMJ 2008; 336: 924-6.
48. Brozek JL, Akl EA, Jaeschke R, et al. Grading quality of evidence and strength of recommendations in clinical practice guidelines part 3 of 3. The GRADE approach to developing recommendations. Allergy 2011; 66: 588-95.
Big data–driven observational evidence in Korea: challenges in interpreting non-randomized studies
Fig. 1. Shared and Role-Specific Responsibilities in Interpreting Big Data–Driven Non-Randomized Studies.This figure illustrates the complementary and overlapping responsibilities of researchers, reviewers/editors, and guideline developers in interpreting big data–driven non-randomized studies within rapidly evolving healthcare systems. Researchers are responsible for transparent study design and explicit acknowledgment of institutional constraints; reviewers and editors for evaluating contextual and clinical plausibility beyond statistical rigor; and guideline developers for calibrating evidentiary weight and transferability. The overlapping domains highlight shared accountability for recognizing residual confounding, contextual dependence, and limitations of causal inference. Responsible interpretation of observational evidence emerges at the intersection of these roles.
Fig. 1.
Big data–driven observational evidence in Korea: challenges in interpreting non-randomized studies
Domain
Key institutional feature
How distortion arises in claims-based big data
Implications for Interpretation
Coverage eligibility and reimbursement rules
Nationally standardized coverage criteria determined by a single public payer
Treatments are initiated only after predefined reimbursement thresholds are met; diagnostic codes and tests may be preferentially recorded to justify coverage
Observed exposures reflect reimbursable care pathways rather than the full range of clinically considered options
Stepwise reimbursement and access control
Sequential approval and escalation requirements enforced at the national level
Delayed treatment initiation and forced stepwise treatment pathways
Exposure timing and sequencing are partially institution-driven rather than clinician-driven
Uniform provider incentives
Homogeneous reimbursement incentives across providers nationwide
Limited variation in practice patterns unrelated to patient characteristics
Reduced heterogeneity may mask clinically meaningful differences
Utilization-driven data capture
Claims data generated primarily for reimbursement purposes
Healthcare utilization intensity influences the probability of diagnosis and outcome detection
Utilization itself may function as an unmeasured confounder
Category
Korea-specific temporal change
How time-dependent confounding arises
Implications for interpretation
Compressed demographic transition
Rapid population aging within a short historical period
Patient populations with the same diagnosis differ substantially across calendar time
Comparability across time periods is compromised even within identical disease categories
Accelerated epidemiologic and societal change
Rapid shifts in disease burden, lifestyle, and socioeconomic structure
Background risk profiles change faster than analytic models can fully capture
Abrupt adoption of new therapies, technologies, and guidelines
Treatment strategies change sharply after specific time points
Calendar time embeds shifts in the treatment landscape
Overlapping institutional and policy changes
Concurrent guideline updates, reimbursement revisions, and public health initiatives
Multiple structural changes are densely layered within short analytic windows
Calendar time functions as a composite proxy rather than a neutral adjustment variable
Table 1. Institutional Characteristics of Korea’s Government-Driven Single-Payer System That Shape Observed Healthcare Utilization in Big Data–Driven Observational Studies
Table 2. Korea-Specific Sources of Time-Dependent Confounding in Long-Term Big Data–Driven Observational Studies